At the very beginning of my internship I posted (in rather mushy way) about the FTIR machine that we have here in the lab. We have quite a good setup here and over the past number of months I’ve been trying to take every advantage I can to use it.

FTIR stands for Fourier Transform Infrared Spectroscopy; but what that really means is that it uses an Infrared energy beam to excite the molecules in a material. These molecules absorb part of the energy and with some fancy maths (god bless computers!) we end up with a spectrum from which we can tell a hell of a lot about the material. In a similar way to how bridges resonate at certain wind speeds or a singer breaking a wine glass, the atoms in the molecules vibrate at defined wavelengths. This means that on our spectrum each peak is associated with a certain type of bond.
So what has all this got to do with the conservation science dept. at the V&A! Well we come across a lot of waxes, resins, varnishes, and of course plastics (which is what my internship is about) in the collection. The identification of these materials is important because it not only helps us in carrying out conservation treatments, but also in building up general knowledge and information about the lives of our objects – like on the trade routes used in their manufacture. We can also learn a lot about the decay of objects by looking at peak ratios or the formation of new peaks.
We use two main methods here in the lab which I like to think of as the “quick and dirty” or the “long, but fun” methods. The “quick and dirty” method is technically known as Attenuated Total Reflection (ATR) and works by the phenomenon of total internal reflection. I call it quick and dirty because the sample prep time is quite short – you only need to place the sample on top of a sampling cell that is about 2mm2. It’s dirty because the quality of spectrum is very dependent on external factors like having a uniform thickness, having the correct pressure over the cell, having a uniform sample and most importantly having enough sample to cover the entire cell.
The “long, but fun” method is called transmission as the light source goes through the sample. This method can lead to a spectrum that is clearer and stronger than ATR but is long because of the sample preparation. First one must mount a sample onto a diamond cell.

Unlike the ATR method, transmission only needs a tiny sample (size region: grain of fine sand). The small size requirement is due to the ability to use a microscope to focus on an exact spot to analyse. The down side to using a microscope in this way is that you need to align everything correctly which takes time! The fun side is this method requires the detector to be cooled via liquid nitrogen…see my previous post for the fun we have!
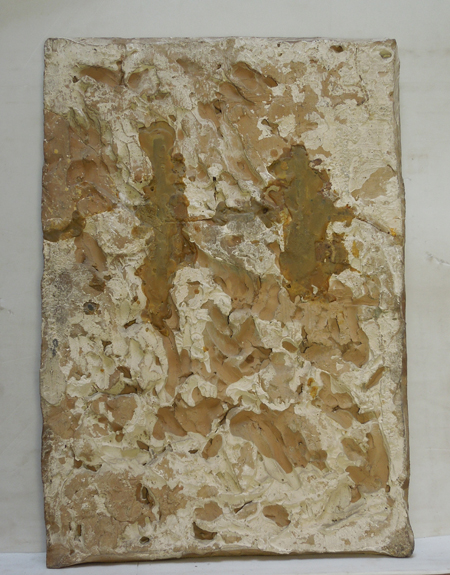
An example of the differences between the two methods is perfectly demonstrated by an object we analysed that was treated by Camille Devilliers, an intern in the sculpture conservation department. Camille had a terracotta that had split in half and had been previously repaired by ‘cementing’ two iron dowels into the back of the object. Camille needed to know what the material holding the dowels in place, and what were the other materials used in the previous treatment. With these pieces of information she could select the correct method to remove the dowels without damaging the object.
The graph below shows two spectrum of the same sample from Camilles terracotta – one taken using the ‘short and dirty’ method (shown in red), the second spectrum, in blue, results from the ‘long, but fun’ method. Looking at the graph it’s easy to see that the strength of the red line is much less than the blue; what’s not so easy to spot is that the peaks don’t exactly match – the red peaks are shifted slightly compared to the blue peaks. When we come to search against the database we see that the red line has an 89.23 match with Beeswax AND with Carnauba wax. This isn’t what we like to get when we search! Thankfully if we used the ‘long, but fun’ method we see that the blue line had a 98.25 match with Beeswax and the first 5 results were all forms of Beeswax; no Carnauba to be found which is perfect!
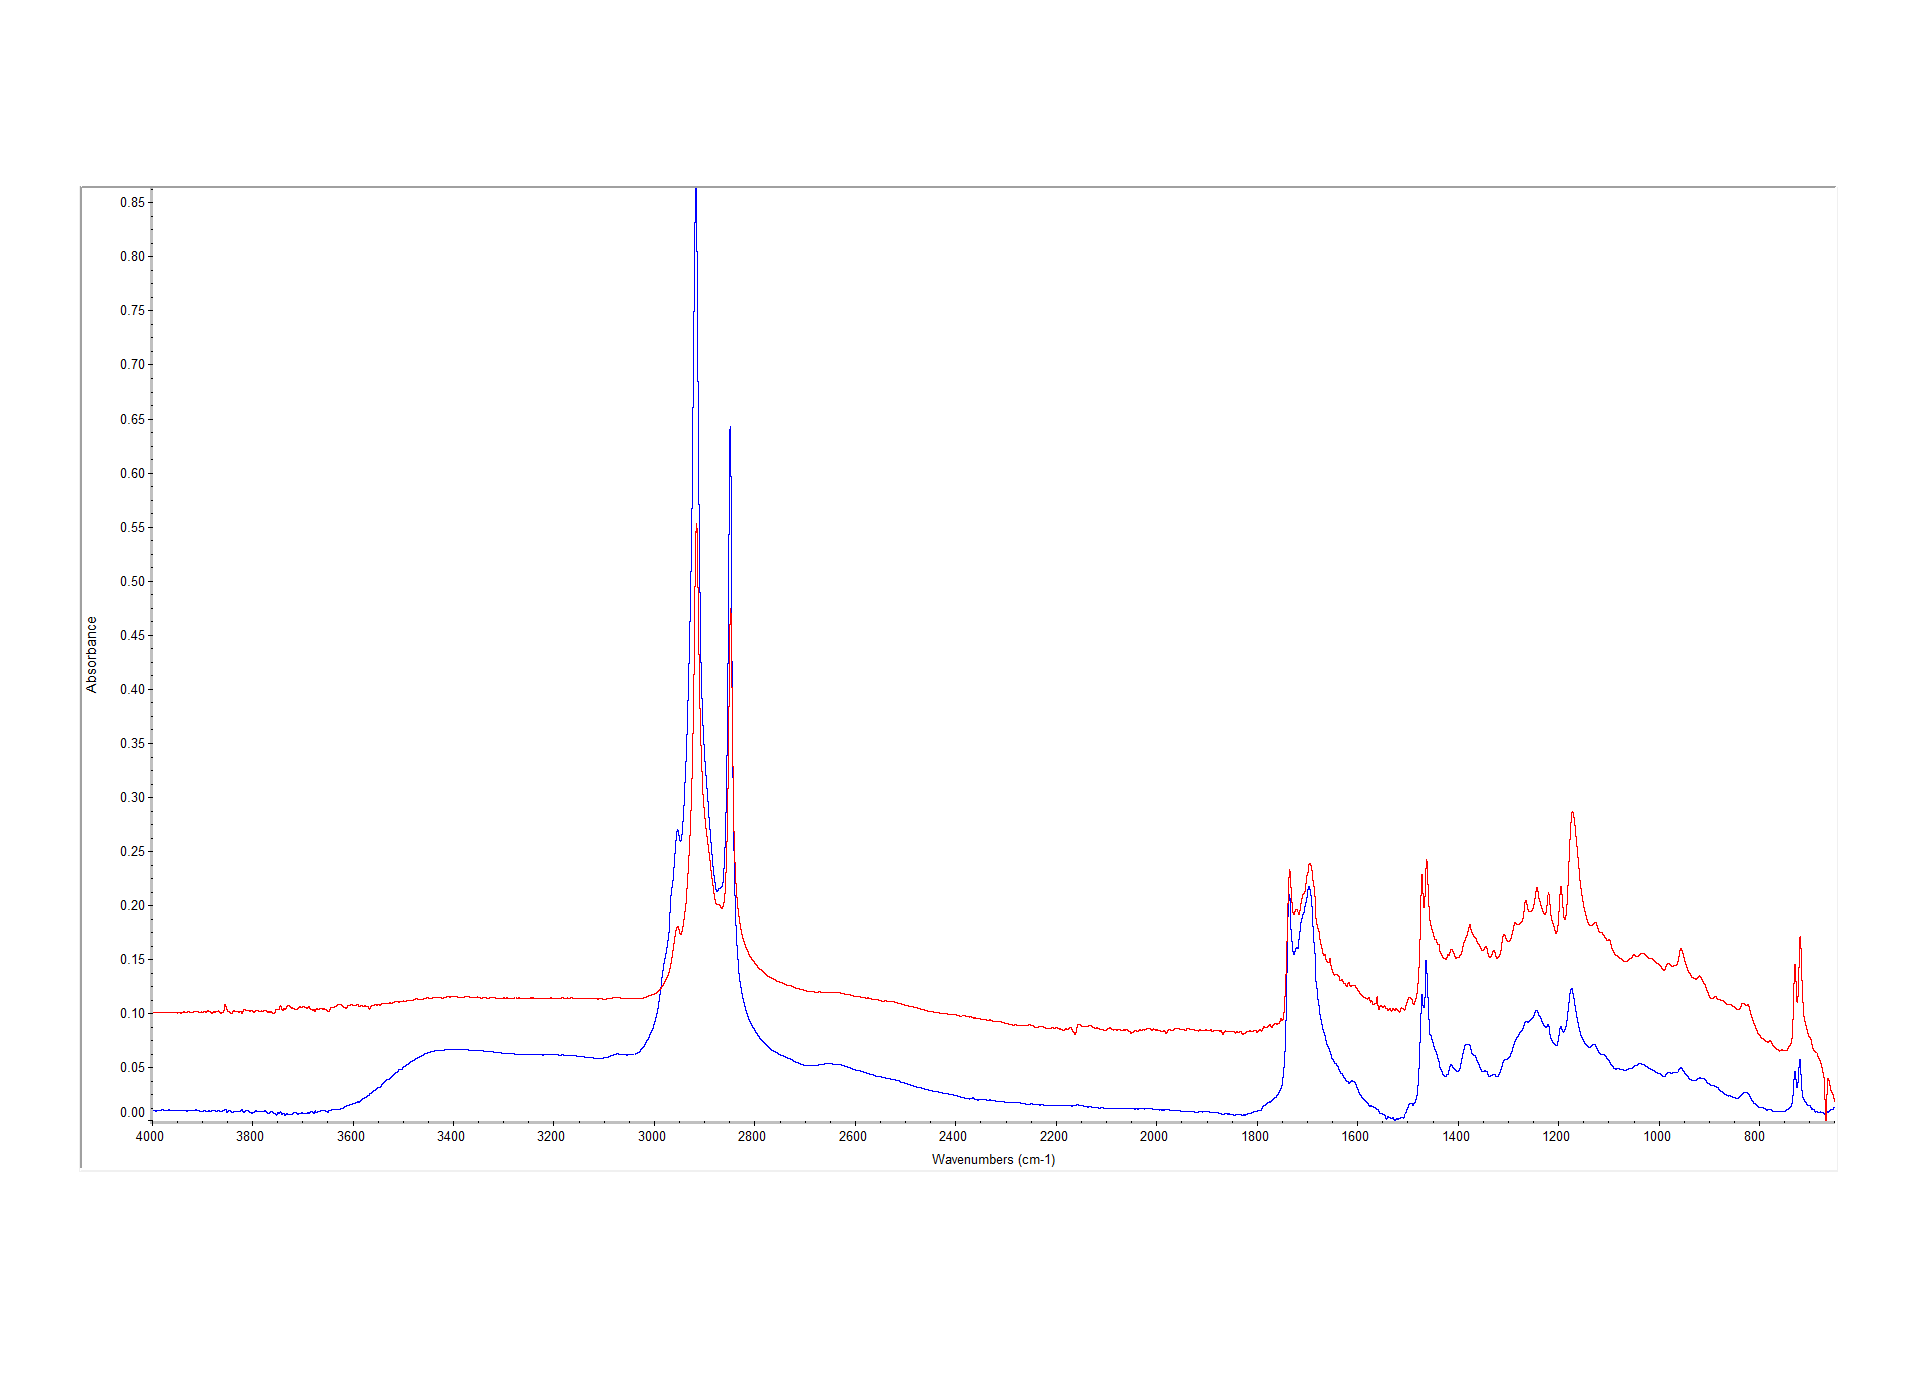
This clarity is whole ball game! When we look at more complex spectra or something that is a mixture, the greater the strength of the sample and the non-shifting peaks means it can be far easier to identify the material.
Very informative.