Conservation Journal
Spring 2004 Issue 46
The OCEAN project at the V&A
Environmental monitoring is an essential feature both of routine collection care and of the mounting of exhibitions. External lenders of objects will often place stringent specifications on display conditions, and will commonly require proof of compliance. In the case of the V&A, as with most other large institutions, environmental monitoring has seen many approaches used over the years, with varying degrees of success. The OCEAN (Object Centred Environmental Analysis Network) project is an attempt to combine the cumulative practical experience of the V&A staff with the technical expertise of an external company in order to produce a robust and user-friendly monitoring system. At the V&A, this new radio based system will consist of a thousand or more environmental sensors over a range of geographically separated sites.
In particular the following key specifications were made for the system:
-
Each end user should have their own customized view of the system, depending on their area of responsibility
-
The level of system access should be controlled based on individual users
-
The system must offer a quick visual indication of conditions in all relevant locations
-
Report generation facilities should be comprehensive and under the control of the end user. Depending on access level the report should range in complexity from a simple summary up to a distribution analysis
-
Automated periodic reports should be available
-
A simple calculation representing an overall assessment of conditions should be available
-
There should be a full calibration/audit regime in place
-
Minimum intervention should be required by the system administrator under normal circumstances
-
The system should cope with short-term power and network failures
The past few years has seen a gradual move away from manual data recording devices (such as thermo-hygrographs and data loggers) towards centralized systems, which offer an automated collection of readings. These systems are inevitably based on modern information technology infrastructures such as local area networks and PCs. As any computer user will know, this brings its own practical problems but, nevertheless, the savings in staff time and the availability of on-line real-time data has made this the preferred approach for institutions large and small.
In parallel with the developments in IT there have been many advances in radio technology, to the point where it is now practical to reliably cover even the largest buildings using low-power, license-free radios in battery powered devices.
The approach taken for the OCEAN project was to combine radio sensors with the Museum ’s networking facilities. The general layout of the system is shown in Figure 1:
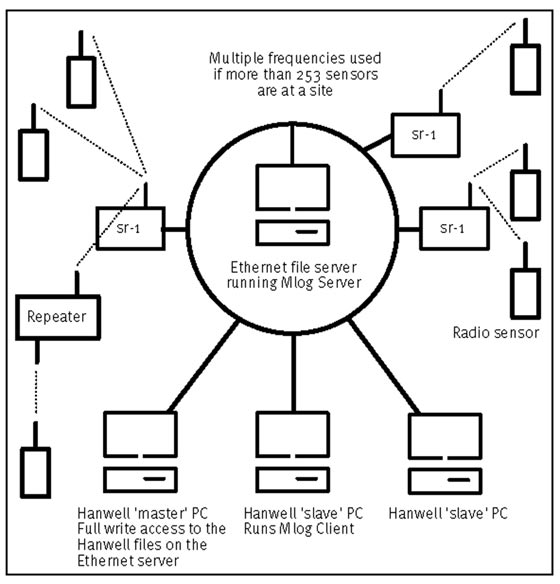
Figure 1. System schematic (click image for larger version)
In this scheme the total requirement is broken down into cells in a configuration similar to a mobile phone network. Each cell supports up to 250 sensors transmitting to a Smart Receiver (SR1) radio/ethernet converter unit. The cell will have its own designated radio frequency and may have within it repeater units as required. Each SR1 has its own fixed network address, which may be on a local or wide-area network. Each cell automatically registers sensors and their serial number.
The SR1s contain both memory and back-up power and are periodically interrogated by a program running on a dedicated server. This machine also runs the access control software and a server program. Users communicate with the server via client software, which has been customized for this project. The system administrator has remote control of this server.
The system software represents a major development of Hanwell’s RadioLog industrial monitoring system, which itself has origins in the well-established environmental monitoring system (EMS) used world wide in the heritage sector. These two products are intended to support typically 100 or so sensors and are primarily text (list) based, although simple graphic representations are available.
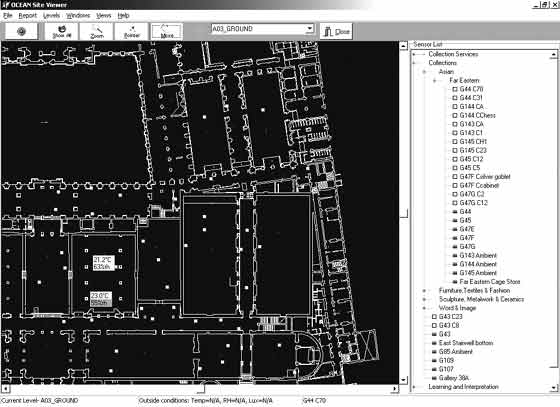
Figure 2. site screen (click image for larger version)
Any, or all icons, can be expanded to show live values and to allow access to graphing, etc. via a pop-up menu.
Each sensor is assigned to a site, a division and, optionally, a department, section and subsection. Each user is given a scope of view based on the same scheme. These two pieces of information are used to create the tree view (right pane) and to customize it for each user. All sensor icons appear in collapsed form for all users but only those that appear on the tree can be processed in any way. Clicking on any tree entry will cause the drawing to adjust as necessary to show that sensor. Those sensors in alarm appear in a similar tree structure in the left pane. Currently each layer of the drawing represents a floor of the Museum but this is totally configurable to suit individual site requirements.
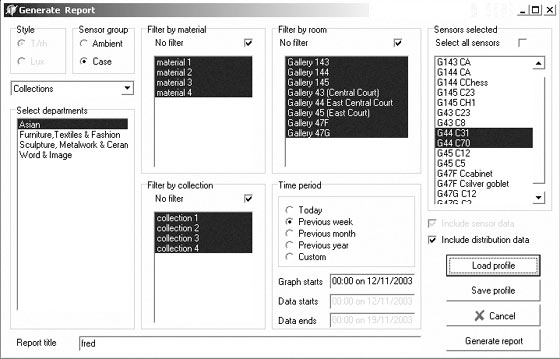
Figure 3. Report selection (click image for larger version)
The system manager allocates every user an access level and this level is used to restrict the range of actions that can be performed by any individual.The usage of the system is registered in the audit trail as users log-in and log-out.
Report generation is a key requirement. The user can readily select and filter all of the sensors within his view and generate an Adobe™ portable document format (PDF) report in an optional level of detail, for any time period of interest (Figure 3).The filtering distinguishes between case, ambient and external sensors to ensure that like is compared with like. All of the normal performance figures required, such as time within specification, are automatically produced without the need for any spreadsheet work, as has been the case in the past.
Currently one cell, representing approximately one quarter of the South Kensington site, has been installed and the software is largely complete, the main exception being the functions related to the automatic e-mailing of reports.
The current intention is that the remainder of the hardware will be installed at the main site during the first two quarters of 2004 with the other buildings added in late 2004/early 2005. The e-mailing options will also be completed in phase 2 of the project and the software rolled-out for general use. The system is working well with a high reliability of radio coverage and a few regular users. Interested
eaders should contact Graham Martin or Boris Pretzel in the Science Section.
Acknowledgments and Informations
Hanwell Instruments Ltd., 12-13 Mead Business Centre, Hertford, SG13 7BJ, UK
AutoCAD™ Autodesk, Inc.,111 McInnis Parkway, San Rafael, California 94903, USA
Adobe™ Uniroyal Chemical Company Inc., Benson Road, Middlebury, Connecticut 06749, USA
Spring 2004 Issue 46
- Editorial
- The new paintings galleries
- The cleaning of two paintings by Turner
- The conservation of three gilded frames for the new paintings galleries at the Victoria and Albert Museum
- An introduction to gemmology
- Restructuring of the Department
- Staff development in conservation issues
- CoSHH does work
- The OCEAN project at the V&A
- An Indian painting workshop led by Shammi Bannu
- Printer friendly version