Conservation Journal
Autumn 2004 Issue 48
Planning and estimating
Figure 1: Extract from CSD Public Programme (click image for larger version)
The bringing together of the Departments of Conservation, Exhibitions, Photography, and Records and Collections Services into a Collections Services Division (CSD) at the beginning of 2002 created opportunities for more joined up thinking about these museum operations. A Planning Group representing all CSD departments was quickly set up to help achieve this. As a first step, a document, the Public Programme Chart (figure 1) was created to bring together in one place a list of all the planned, public-facing, object-based activities over the next five years.
The group then turned its attention to long range estimating and forecasting of our capacity to deliver the projects listed on the programme. The aim was to come up with a simple method of predicting the resource implications of proposed projects based on previous experience. One way this might be achieved was by looking at statistical averages of numbers of objects per square metre in different types of display and the average treatment times for objects and bring this together into a framework that would enable predictions to be made. The challenge was then to apply this to a different population of objects.
Given the bewildering range of different object types and materials, the Planning Group first reduced this complexity to just six simple, easily recognisable groupings based on size and object complexity. A simple matrix of small vs large and 2D vs 3D was established and tested against sample groups of objects in the Museum to see if this would provide a reliable basis for classification. This then led to the adoption of the following six categories of object:
- Small and simple 2D
- Large and/ or complex 2D
- Small and/or simple 3D
- Large and simple 3D
- Large and/or complex 3D
- Outsize or complicated (exceptional)
The group then asked conservators, photographers and technicians to predict how long it would take them to conserve, photograph, move and install objects in the different categories.
To achieve good predictions it was also necessary to take account of the purpose of the work for which the estimate was being made. This was formally expressed as class of activity. The five classes of activity were established as: loans and acquisitions, exhibitions, new gallery displays, gallery/store clearances, publications. Once this was adopted, more consistent and reliable estimates could be produced.
Each CSD section then determined the average amounts of time required to carry out their work on the different categories of object for the different classes of activity. Each activity was given a separate calculation matrix (figure 2).
The Public Programme was used to identify projects that required resource calculations. Information on the number and category of objects for a project was then obtained by either research or assessing the objects in situ. The resource required was then calculated by entering the data onto the Template (figure 2).
The figures from each project were then automatically transferred to a master sheet showing cumulative levels of resources required to service all projects within a given period of time. Units of time were reported on in quarters of a year. Levels of available resource are put into the master sheet: this enables spare capacity or over-scheduling to be highlighted.
The model aims to provide a rational basis for decision making in the overall museum planning process. It provides base line figures but can be adjusted where more accurate assessments of objects are required or where a certain project breaks the 'norm' (e.g. when all of the objects in a project are large tapestries). Data from areas outside the CSD (e.g. Collections) can also be incorporated into this tool. As projects are completed, actual data can be input to increase the validation of the results.
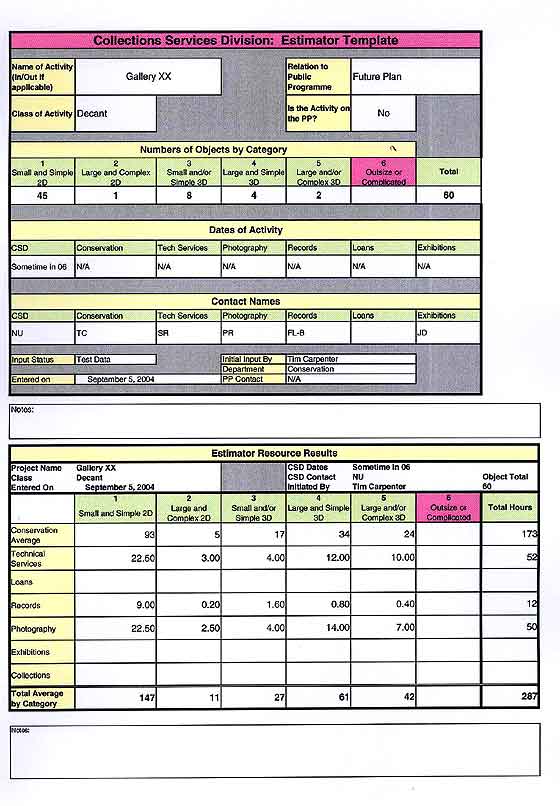
Figure 2: CSD Resource Estimator: Estimator Template with Gallery/Store clearance data (click image for larger version)
We have used the Estimator already to demonstrate where there is insufficient staff time to deliver museum projects. This has not only helped in securing additional staff resources, but has also enabled managers to review priorities and deadlines for work. Responses such as moving opening dates and changing resource focus have also been possible.
Since the Public Programme Chart was first created, it has been adopted by a wide range of colleagues. At first the brightly coloured programmes were a curiosity at meetings, but others quickly saw their use and began asking whether they might take copies. Now a circulation list exists and monthly updates are spread around the institution. It is hoped a similar pattern of interest and adoption will be seen with the Estimator. There is already interest outside the Division, with requests for projects to be run through the Estimator to see what the resource implications are.
Our long term vision is for the Estimator to become a core tool in the overall planning process. To achieve this, we must simplify the inputting process for proposed projects and agree a management structure for reviewing the output. This will then provide a simple and easy to read interface which will give clear predictive messages for managers to engage with and make decisions.
Autumn 2004 Issue 48
- Editorial
- A souvenir from Guangzhou
- Conservation Department seminar report
- An away day to Belgium: Washing tapestries
- Yomeimon of Toshogu
- Nasrid plasterwork: symbolism, materials & techniques
- Mixed media object: large and fragile structure
- Planning and estimating
- RCA/V&A Postgraduate Conservation Programme
- Printer friendly version