In this post we show how you can capture useful data that shows how your visitors are using features that are unique to your site. This is something that you can’t get from out-of-the-box Google reports.
Google Analytics is great for all sorts of useful general stats. However, your services will always have unique features. We show how it is worth spending a little time planning data structures that represent the user behaviour you want to understand. By collecting data in a logical way, you can get things like this:
- precise information about user interactions on features only your services have
- clearer reports that more people can understand
- clues about how far people delve into games and other interactive features and what they really do when using them
It sounds harder than it is. We show here, how we have started to do this, using the following Google data techniques and tools:
- Google Analytics Event tracking – planning how you set up categories, actions and labels to collect data will give you information you can actually understand. Good practice in your code makes this much easier.
- Google Tag Manager – you can remotely manage the collection of in-game data. You can even collect new data if you have missed something off, without playing with the in-page code.
As always, feel free to use anything here. This is just one simple example. Take any ideas and adapt them in any way that helps you.
Simple techniques with real examples
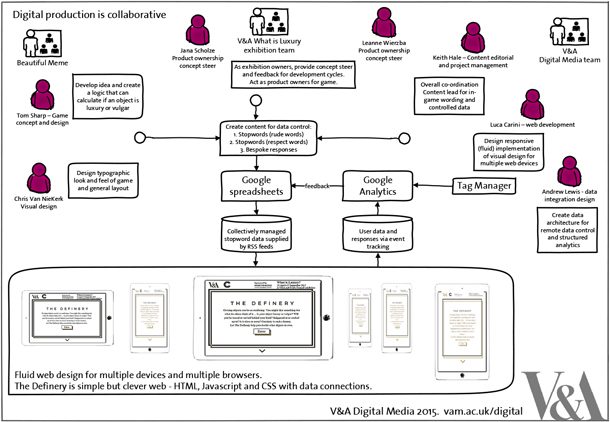
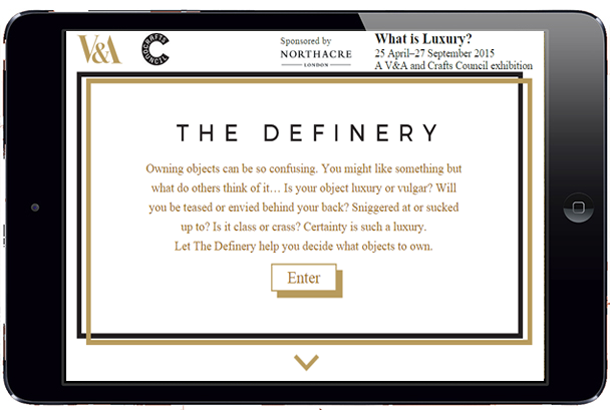
To illustrate how you can set up your own metrics, we step through what we did when we made a real game called The Definery. This was created for the fabulous V&A/Crafts Council exhibition What is Luxury? It was devised for the exhibition by digital agency The Beautiful Meme and developed collaboratively between the agency, exhibition curators and members of the Digital Media team.
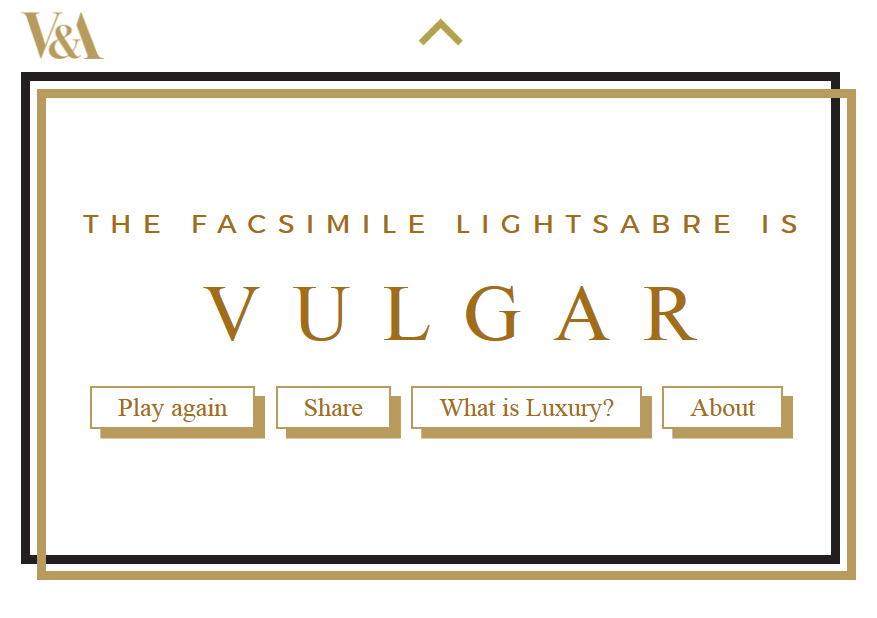
The Definery makes people think about the concept of luxury by prodding their emotional attachment to things they own. It is a quiz-based game that asks questions about your prized possessions and your attitudes to them. It then judges if your stuff is luxury or vulgar.
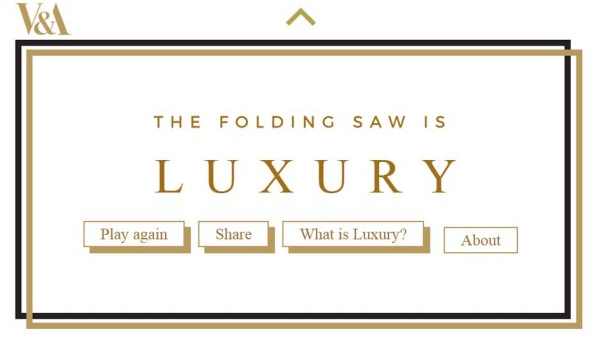
Here’s an example of an object

And here is The Definery result judging it to be a luxury item.
You should play the game first ideally, so you can see the relevance of the methods applied here. Just don’t blame us if all your stuff comes out vulgar.
LAUNCH THE DEFINERY TO SEE IF YOUR POSSESSIONS ARE LUXURY OR VULGAR
Once you’ve risked the indignity of The Definery’s judgment, you can read how we designed data capture to measure in-game behaviour. For example, we will have received data about how you played the game – your answers, your result and any subsequent actions you may have taken – in a way that allows us to compare your reaction to the reactions of other players.
Google Analytics Event Tracking is easier using Tag Manager
We used Google’s rather clever Tag Manager tool to set up Event Tracking. We have only just started using this. We are using the second version of Tag Manager, which became standard from late May 2015 (originally released as beta in October 2014).
Event Tracking is Google’s excellent behaviour tracking system that records when actions have taken place. You tell it what to count and it will gather data as evidence of how people do things. We have been using it for a few years to track things like navigation links, image promotions, calls to action, selectors and so on. It gives hard data on what people really do.
The techniques described here build on principles covered in this 2013 Digital Media post.
How to use Google Analytics Event Tracking to capture navigational behaviour on your website
The big update outlined in this post is that we now deploy the code remotely from the Tag Manager web console without manual releases of the main web page code – much more efficient and less tinkering with the live site.
Design your own metrics to find out what you want to know
Using default metrics in Google Analytics is a little bit like trying to understand what people are doing in a crowded gallery by standing on a balcony above it. You can only get a broad sense of what’s going on, what people are doing, what the mood is and so on, but it’s all a bit general and average.
What you really need to do is get down in there and study individuals doing the things specific to your services – the things you want to understand that you can’t get from generic metrics like page views and sessions.
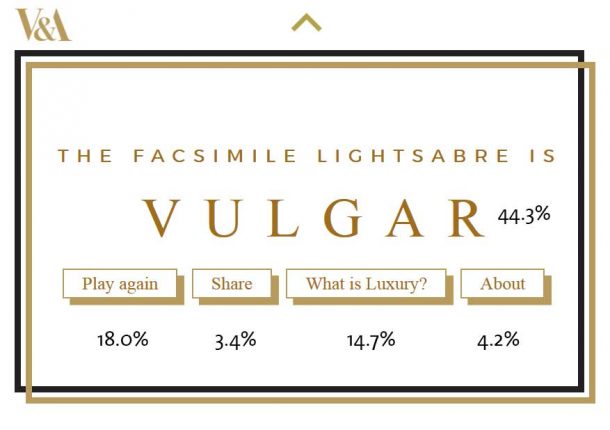
Here’s an example:
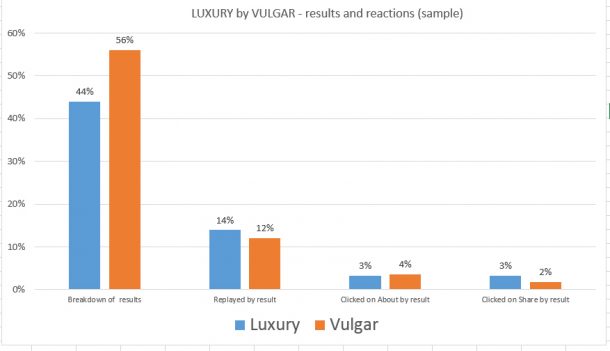
This graph shows bespoke data from The Definery game. The left hand pair of columns show the simple relative occurrence of results. This is interesting, but it is nothing amazing in itself. It does not tell us anything about behaviour.
However, the three right-hand pairs of columns are much more interesting. They show how often people acted upon calls to action, mapped against the specific result they got. This shows that interactions within the game are measurably affected by what happened to the person in the game.
The data here indicates that players are 50% more likely to share their result if it was Luxury compared to if it had been Vulgar. This is possible because the data capture was planned and implemented in a way that in-game clicks could be associated with in-game results.
This is a simple example, but shows how well-designed data capture can give you targeted feedback about user behaviour. This information allows you to make evidence-based choices within future development of user interactions and calls-to-action.
Here’s how we have started to formalise this planning into good practice. While practice will make you better each time, we have found being systematic means we get better, faster.
A checklist for designing behaviour-capture in Google Analytics
Here’s a simple checklist that can help you be more effective when building data-capture into your digital services…
- Agree objectives – what are the aims you want to test?
- Define success measures – what data would allow you to test those aims?
- Check if you need to go bespoke – is the data you need already captured somehow?
- Consider ease of reporting – how can you get the data out in a way people will understand it?
- Design your data hierarchy – what data structure will make reports look the way you want them to?
- Apply hierarchy to in-page code – make sure any bespoke data is generated by your code and that page element attributes reflect the data structure needed (CSS classes, HTML element ids etc.)
- Configure Google Analytics – apply triggers that capture data when the user behaviour occurs. In this case we’re using Tag Manager.
- Test – once in place, see if it works!
- Tweak! – once you get data you can always use it to adjust the capture if needed
Example of a project using this checklist
Here is a run-through of how we did this within The Definery game, to show what this means in practice.
1. Agreeing objectives
The Definery is essentially a quiz game.
Its main objective is to make people think about what makes an object a luxury object, to get them thinking about what luxury is. This is the main theme of the exhibition it supports.
Another objective was to see if we could gain any sense of people’s views on luxury from the objects they submitted.
A third, more general objective was to understand if people’s behaviour was affected by the judgements the game made. This was to see if we could get clues about feature design, that might inform future development.
2. Defining success criteria
The game asks people to subject one of their possessions to a test that will judge it as luxury or vulgar. The assumption is that by playing the game, people will wonder why they got their result (especially if it was not the result they expected) and therefore think about luxury as a concept.
We wondered how can this might be measured…
How many times has the game been played?
One simple measure of success was how many people played the game to completion. This indicates how many people had been exposed to the concept. Obviously this is a pretty superficial measure, but it was a start.
Proportion of players who replay the game
The proportion of replays is a more meaningful measure of whether people are thinking about the concept. This shows active engagement and implies deeper thinking because anyone playing the game again could be assumed to be sufficiently interested in the idea, to retest the logic that gave the result.
How many people looked at further information after playing?
The game had options allowing people to find out more, either by reading an “About” page or by visiting the exhibition pages. This was another indication of continued interest in the concept.
Do the objects submitted tells us anything about people’s views on luxury?
We obviously wanted to know what people submitted. We were interested in seeing what players’ objects might tell us about their views on the concept of luxury. We also could use the results to adjust the algorithm if necessary. In this case, it was not so clear how the data might show success, but worth recording nonetheless.
How results of a game affect subsequent behaviour
The aim here was not to promote the exhibition concepts, but to get feedback on how people really use a game. The game’s simple binary result is deliberately provocative. Your possessions are judged as either luxury or vulgar. We were interested to see how this might affect behaviour.
One indication of success we hoped to see, was if the data we gathered showed patterns of behaviour that differed depending on the result. This would show that the game design did affect how people reacted.
To measure this theory, we needed not just to count the number of button presses, but also count button presses associated with the player’s luxury/vulgar result.
3. Checking if we needed to go bespoke
Clearly most of the options described above are specific to this game and so would be impossible to capture without building in bespoke data capture. However, not all of these had to be set up. For example, the time people spent playing the game was of interest, but “Time on page” is a built-in feature of Google Analytics. It came for free, so we didn’t need to build that in ourselves.
4. Making it easy to read the reports
It was important that the basic data being captured was easy to read by people who are not information scientists or data analysts! We wanted any of the project team who had only a basic knowledge of Google Analytics to be able to read the results at a glance.
For this it was important that we used plain English and no abbreviations, so “clicked on replay button” would be preferred to “rply_btn_clkd”, etc.
5. Designing the Data hierarchy that gives you the reports you want
This is where a little thinking is always a good investment. In Event Tracking, there are three main levels of groupings that you have to play with. These are:
- Event Category
- Event Action
- Event Label
Event Category
The Event Category field is generally used as the top-level grouping. E.g all data from a single game might have a common Event Category. We used two Event Categories to distinguish between two games: Luxury Time and The Definery.
It is obvious to staff which category represents each game. This is something you can agree locally. It is simple here, but if you have 50 categories, you need to plan it a bit more thoroughly.

Event Action
The Event Action field is is usually what people are doing when they are within a web feature or game. This is what we ended up with. As top level data about what players did within the game, this report couldn’t really be much easier to read.
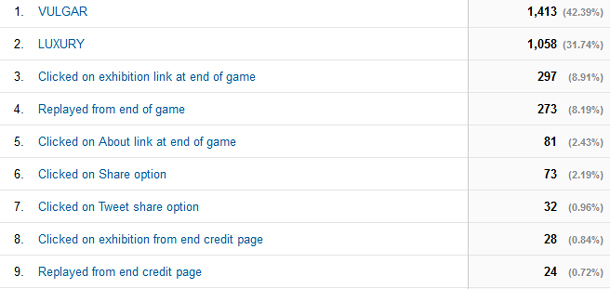
This shows how it is important to carefully name event tracking values.
It is a good habit to start by imagining the report you’d like to get.
Plain English is always the way to go – anyone who reads the above can see the numbers for how much all the option buttons were used.
It seems pretty obvious, but to show how bad it can be, here’s how sensible Event Action naming compares to event actions that derive from code elements. The data from the right hand example may be valid, but for most staff it would be completely impossible to read without extra context.
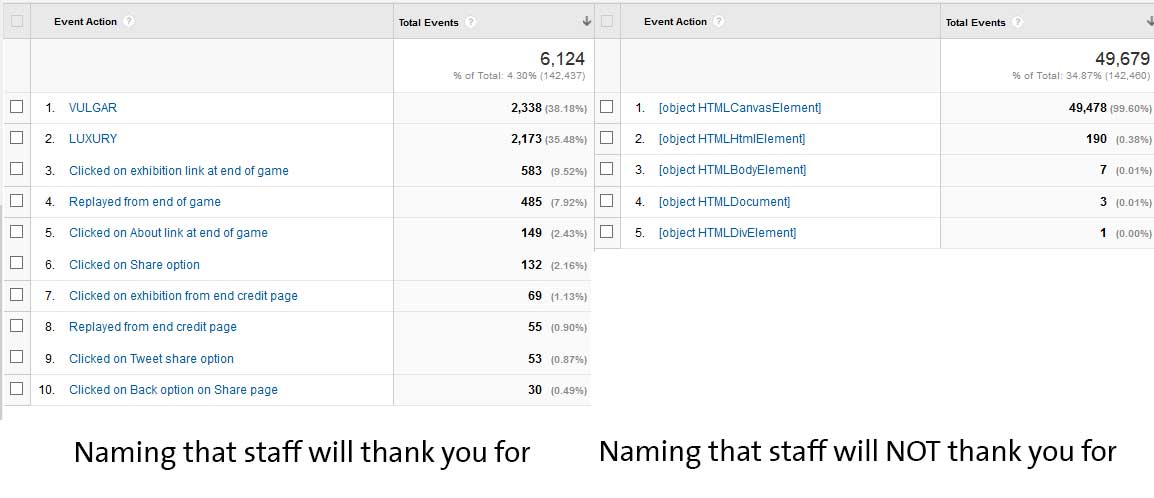
In short, data-naming affects usability. Your colleagues are the users here, so design for their needs!
Event label
The event label field is where the interesting-ness happens in this example. Event Labels are used to distinguish differences in actions. Google describes them as:
“An optional string to provide additional dimensions to the event data.”
This normally mean things like if the event category had been “videos”, the action had been “play”, the label would be the title of the video, e.g. “Trailer for exhibition x”. Or if the category was “navigation” and with actions like “header” or “footer”, the label might be the URL that a link points to, etc.
In this example we pushed the use of the Event Label beyond what it is normally used, because we needed to capture individual results of games and this is a lot of data. Here is how we formatted the event label for collecting game data:
![]()
This is not normal use of the Event Label field!
What is is showing is a comma-separated string of values that represent a single entry for a completed game by one person.
We needed to capture the objects that people were submitting, in this case “Marimekko dress”, BUT we needed not just what they submitted, but also the results they got and the post-result behaviour they exhibited.
Capturing game behaviour relative to results was more tricky. To do this required all interactions after a game had been completed to send and event with plain English Event Action names (e.g. “Clicked on Share option”) and the Event Label with the full game data: (e.g. “2015-05-21,LUXURY,Marimekko dress, 320, 3,5,5,5,2,yes”).
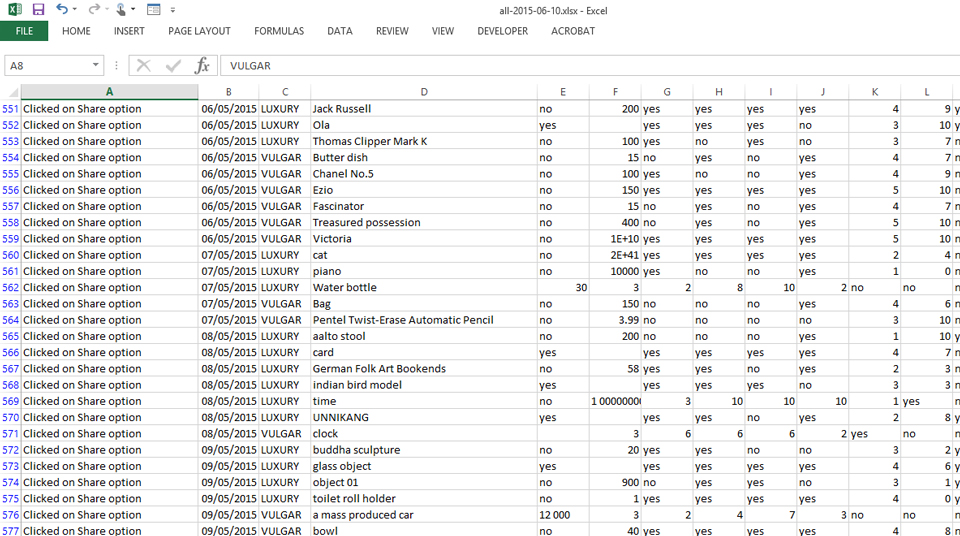
This is easier to understand when you see the results in a report table for a single game. The table below shows the clusters of activity for the same player.
The player who submitted the Marimekko dress interacted in a number of ways…

You can see a pattern of behaviour that shows play, replay (and which specific replay button was pressed to do this) the change of data entered and a change in result as a result of playing with different inputs. This shows the that the share option has been pressed after the “LUXURY” result was achieved.
Using comma separated strings as Event Labels for data exporting
There was a reason why the Event Label field was structured using comma separated values. This was to extract and analyse this complex data, which cannot be done within Google Analytics Event reports directly.
To do this, the Event Action was used, but with Event Label set as secondary dimension like this:
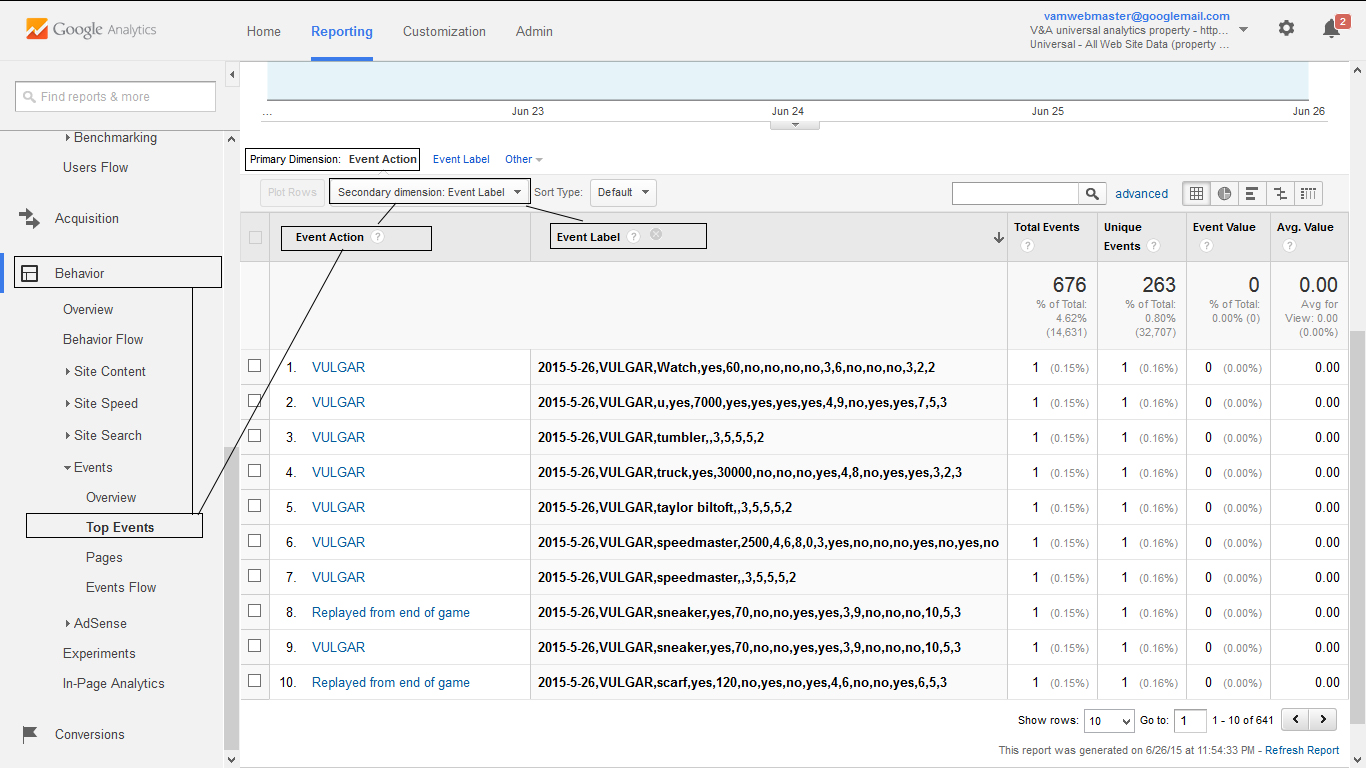
The report was then exported as an Excel file…
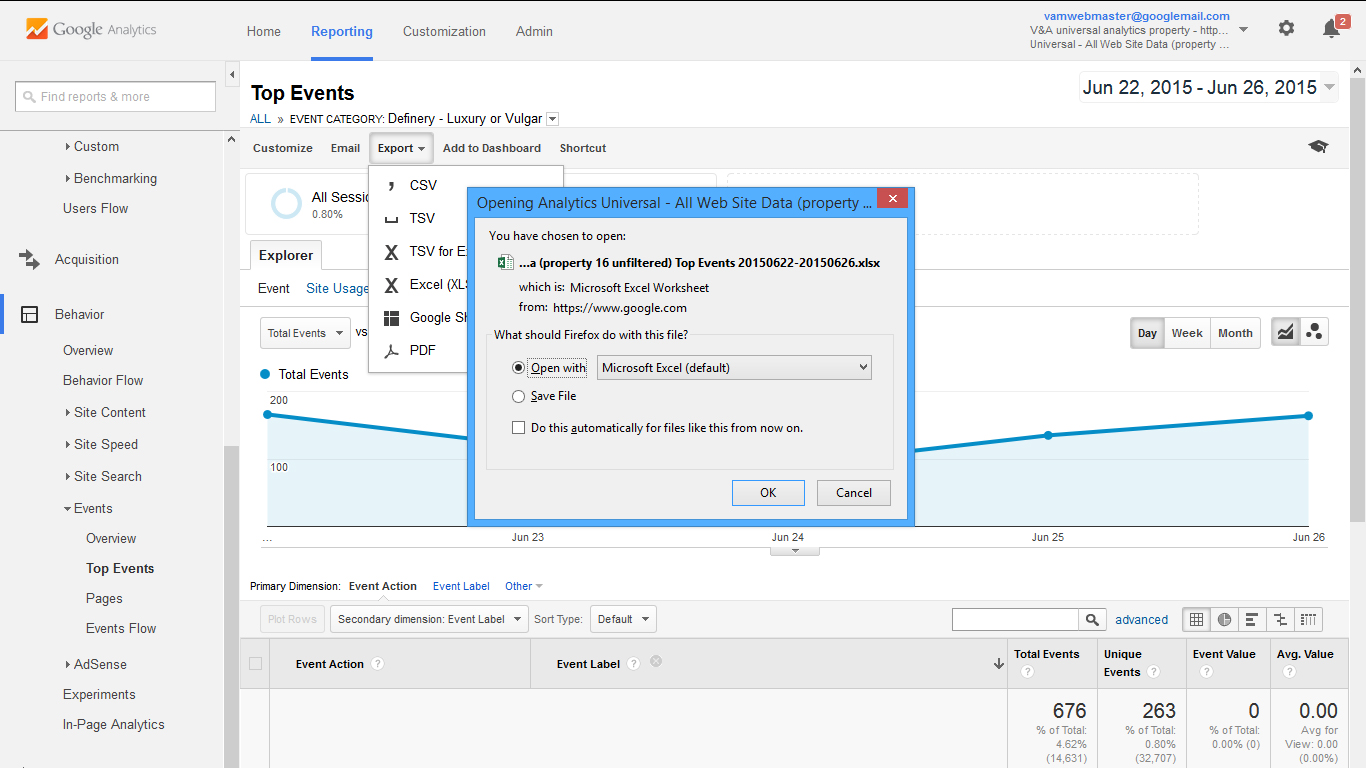
With the exported Excel spreadsheet open, viewing the tab Dataset1 we copied the Event Label column as below…
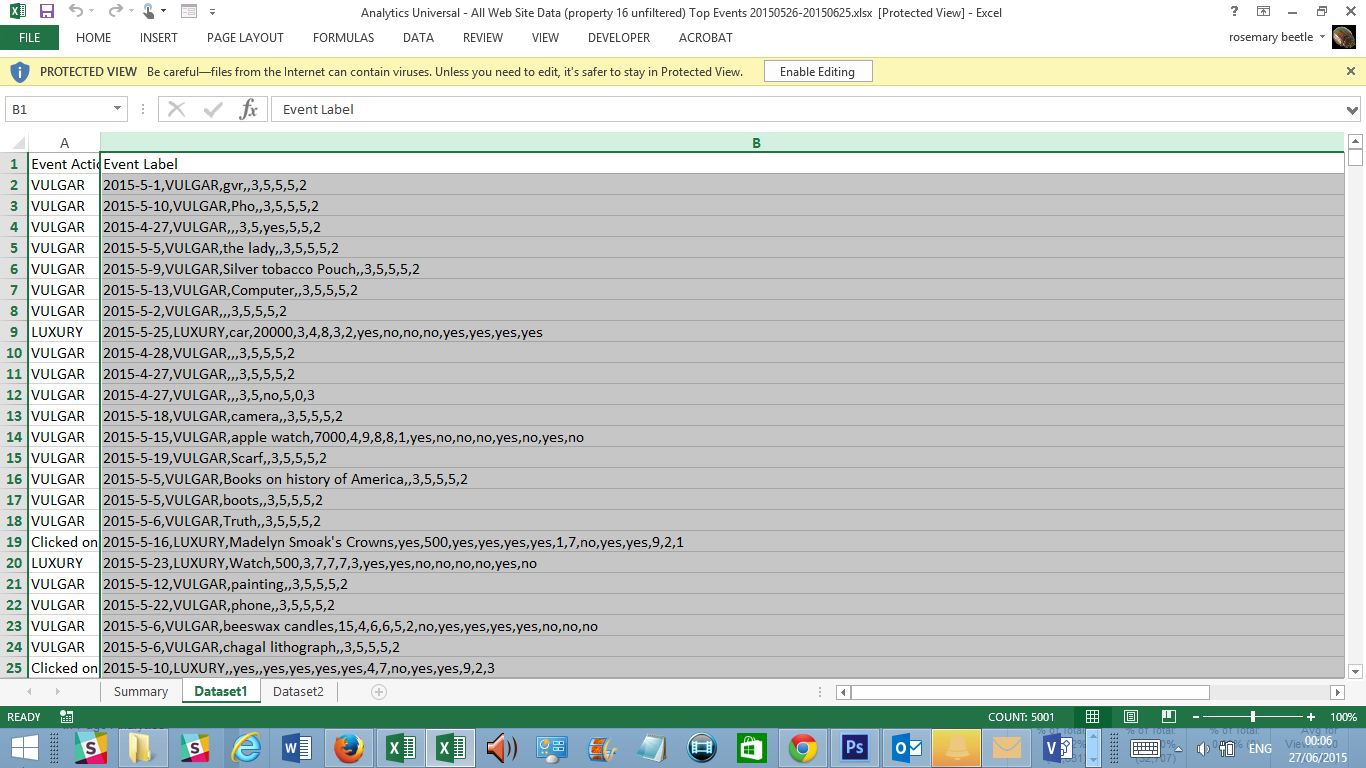
and pasted that into a text editor and saved it as a .CSV file…
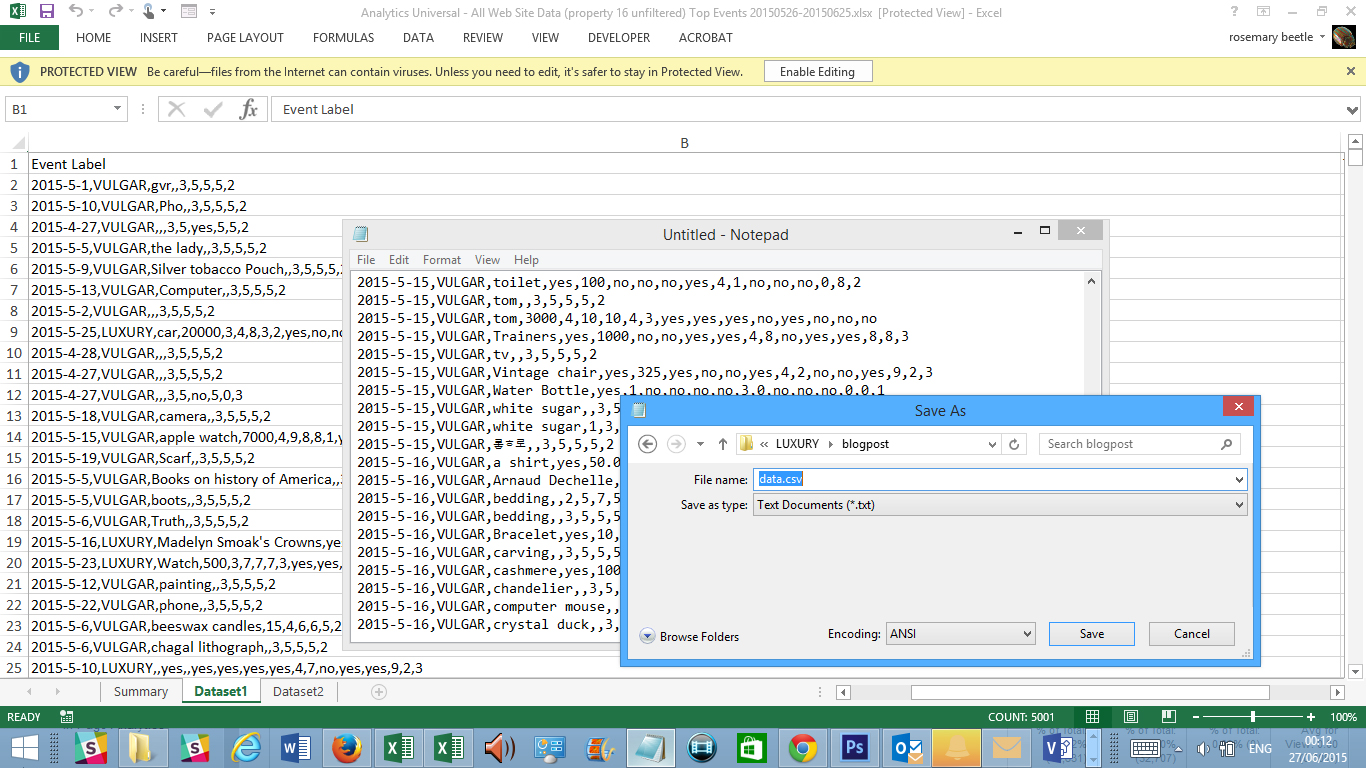
Stick with this…
Once saved, we re-opened the file in Excel.
Excel recognises the file type. By choosing to import the CSV file using commas as the separator, it created a lovely new spreadsheet…

This seems fiddly, but the pay-off was that we now had a nicely formatted spreadsheet with all our in-game behaviour data in neat columns that we could use to filter, sort and apply formulas to, in order to analyse it. Like this…
6. Applying the hierachy to the HTML code
The Definery is just a web page made of HTML, CSS and JavaScript. To track actions in Google Analytics, we needed to identify when specific things have been interacted with. In this case button clicks on calls to action.
This is where well-labelled code is essential. It is easy to do, but needs to be co-ordinated with setting up the event tracking
Let’s look at the replay button as the player sees it in The Definery…
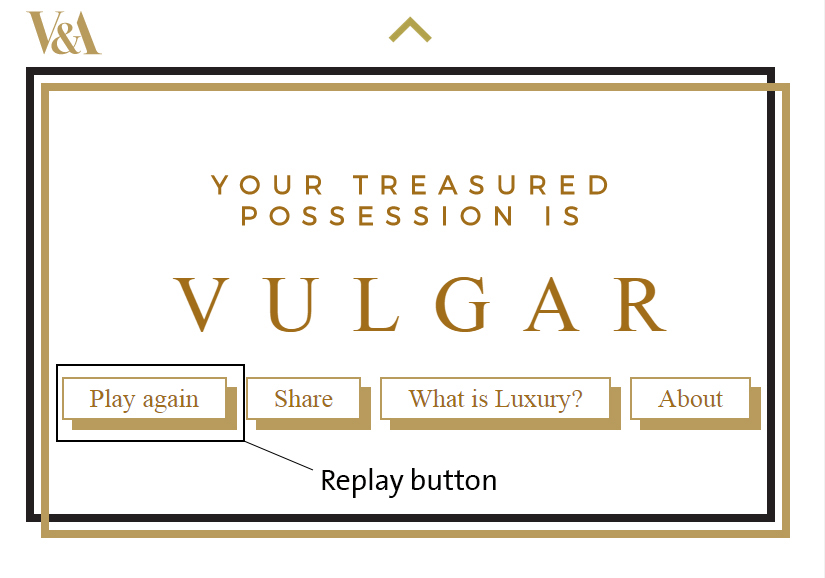
Here is part of the HTML code of The Definery. The top rectangle shows the anchor tag (<a>) that displays the Replay button shown above
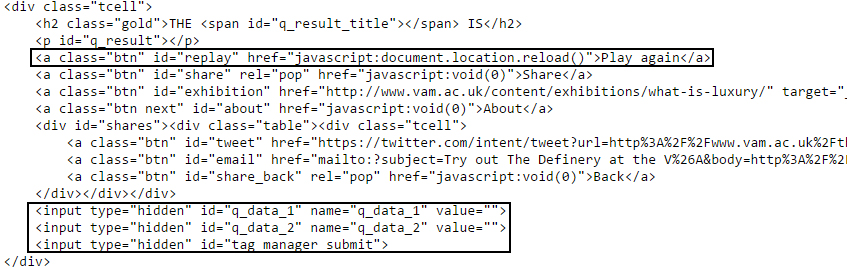
NOTE the following
- The bit that says id=”replay” is the html identifier that distinguishes this button from the others each which have a distinct id. This was used by Tag Manager to identify when this button has been clicked
The second rectangle shows two hidden form fields that store variables that collect the data that represents the choices the player made as they played the game. These two variables were defined as:
- q_data_1 which was used to store the result of the game (i.e. LUXURY or VULGAR)
- q_data_2 which was used to store interaction responses (e.g. “2015-05-21,LUXURY,Marimekko dress, 320, 3,5,5,5,2,yes”)
Here is the code (JavaScript) that sets these variables on submission.
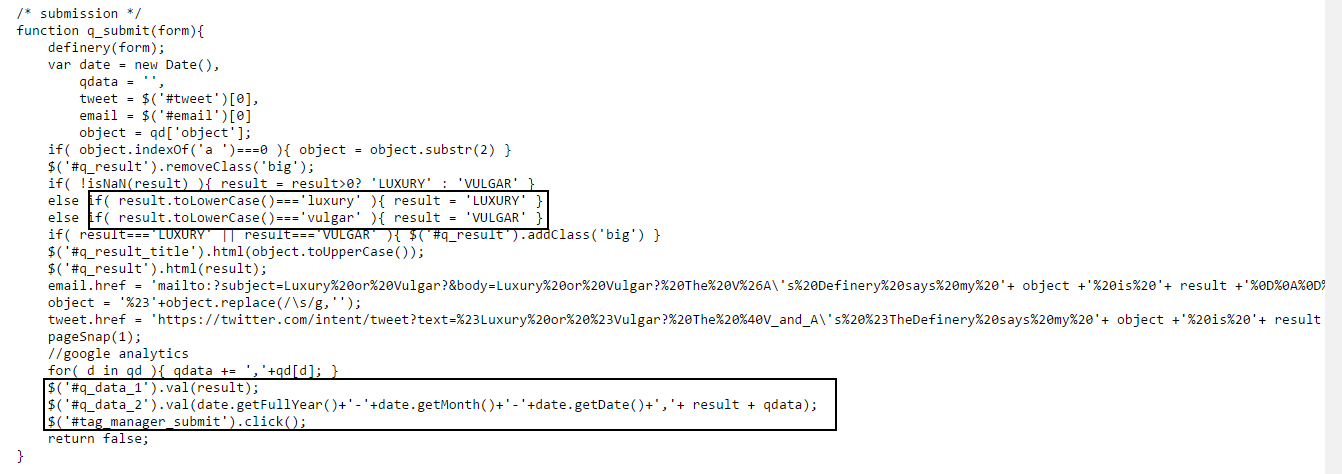
Note:
- The top rectangle shows the result being formatted
- The second rectangle shows the variables q_data_1 and q_data_2 being set and then immediately afterwards the element with id tag_manager_submit is clicked
The significance of this become clear when we get to set up tags in Tag Manager…
7. Configuring the Tags in Tag Manager to get the desired reports
The next step was to make the actions of the player pressing web page buttons fire the structured data we needed into Analytics by defining rules in Tag Manager.
Firstly, the great thing about Tag Manager is that you can create tags via a web console. This simple container code is all you need to add the HTML page. After that it is all in Tag Manager – very good. This greatly reduces the work needed by developers to make ad-hoc additions that was needed with manual tagging and makes the deployment a content managed process.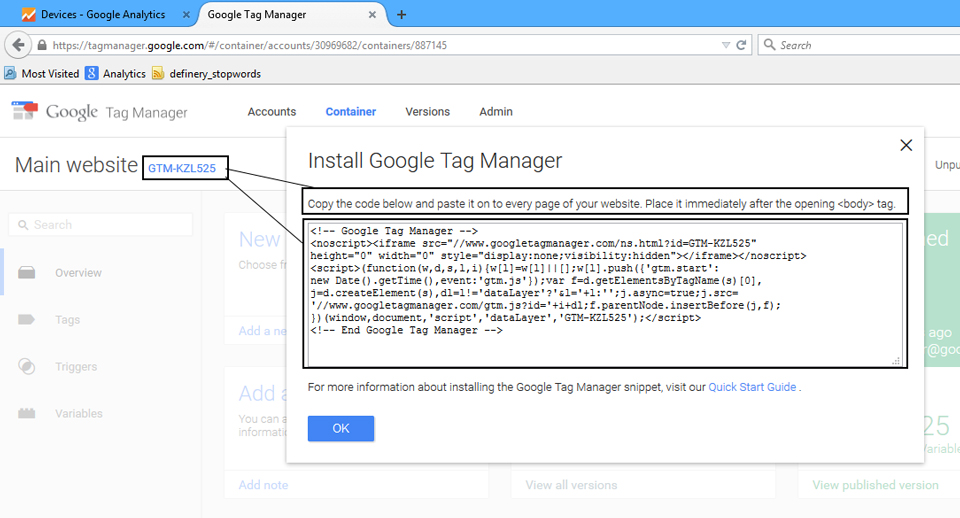
To show how this works, here is the full tag that recorded if the replay button shown above had been clicked, and how it was configured within Tag Manager.

Here are the crucial things to note:
- At the top, the Google Analytics type was defined as Universal Analytics and that the count needs to be made within property UA-376941-16
- The Event Category we need for all Definery metrics was set as “Definery – Luxury or Vulgar”. This was a constant that we typed in by hand. Once set it didn’t change.
- The Event Action was then typed in. It was also a constant once set. The value for this button was “Replayed from end of game”. This is where the plain English got set up. We could have used can use any wording, but it pays to make it one that people can understand.
- The Event Label here was NOT a constant. It is a custom JavaScript variable that was set up to return the q_data_2 game variable
- The box to the right shows how this value was calculated within the custom variable. The value of the variable q_data_2 is set within any one game depending on the choices of the player. This is the big comma-separated result string (e.g. “2015-05-21,LUXURY,Marimekko dress, 320, 3,5,5,5,2,yes”)
- The tag trigger was defined as a Click Trigger. This trigger only fires on clicks. In this case it specifically only fired when the page element that is clicked has the id “replay“.
- A-ha moment – this is why the HTML button needed the id set as “replay”
8. Testing
The main testing here was quite simply just to check that button presses were sending the data. In doing this, we picked up a bug where the submit button was not always sending data. This turned out to be because the calculation that was needed to generate the full value of the comma-separated string takes a short amount of time, whereas the click trigger in Google Event Tracking was sending the contents of the variable before the script had finished updating it.
9. Tweaking
The solution to the testing above was to not use the native submit function, but to use a JavaScript .click() function to only fire after the variable had been updated

Sample results after one month
After the first full month of use, the graph shows quite marked differences in responses to the in-game calls to action within games where the result was LUXURY compared to when it was VULGAR. A general observation is that there was a higher response when the result was LUXURY.
- Likelihood of visiting exhibition page was 62.5% higher for LUXURY than VULGAR
- Likelihood of replaying was 12.9%
- Likelihood of sharing was 208.0% higher for LUXURY than VULGAR
- Likelihood of clicking on About The Definery was 16.0% higher for LUXURY than VULGAR
It is worth noting that while replaying and visiting the exhibition pages were quite healthy numbers overall, the low numbers of people using sharing options may suggest spending a lot of time developing sharing options is not a good use of time.
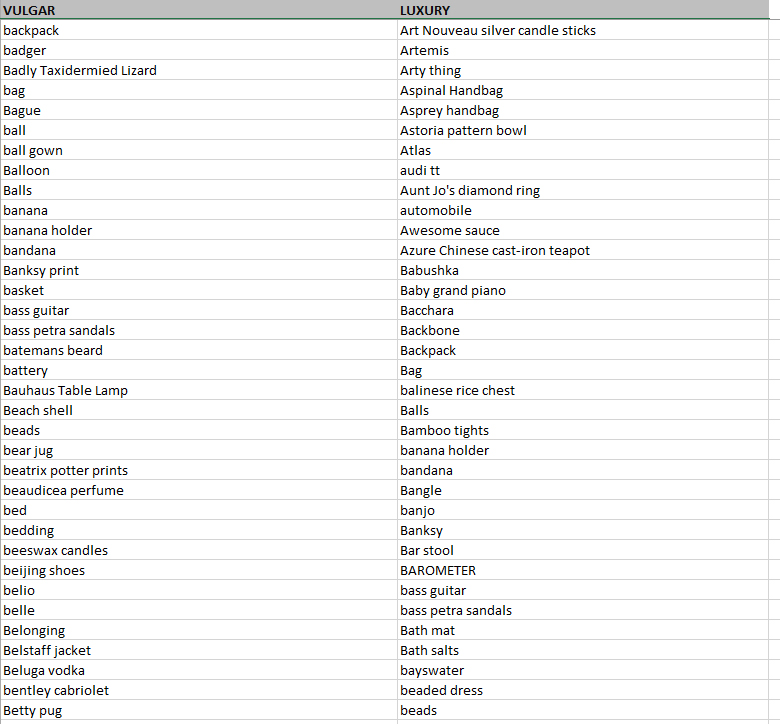
Another requirement was that we could see what objects people were submitting. We have yet to analyse this, but these are fascinating…
Takeaways
Even though this is a simple example, it does have a lot to take in. Fear not, this really isn’t that hard and for anyone developing services, it is an invaluable tool for gathering evidence of usage. The best way to do it is to find something simple you really need to understand. Once you have the Tag Manager container code in place, then you can experiment from within Tag Manager. You can apply tags and take them off quite easily without ever touching you code again.


could you give me this csv file. i’m just student and i need a GA file for searching.
thank you