Chris Unitt is the founder of One Further, a digital analytics and user research consultancy who has been working with the Digital Media team here at the V&A, helping us improve our various products, pages, and calls to action.
Working particularly with cultural organisations – mainly museums and theatres – as well as digital agencies and e-commerce sites, Chris has the rare skill of being able to talk about analytics in plain English.
We caught up with him to chat about what he does and how he does it.
Briefly, what sorts of things have you been doing at the V&A?
I work on most aspects of the V&A’s digital analytics. When the digital team launch something I make sure the right data’s being captured so that the performance of that thing can be understood (and hopefully improved) further down the line. Google Analytics is the main tool we use, but by no means the only one.
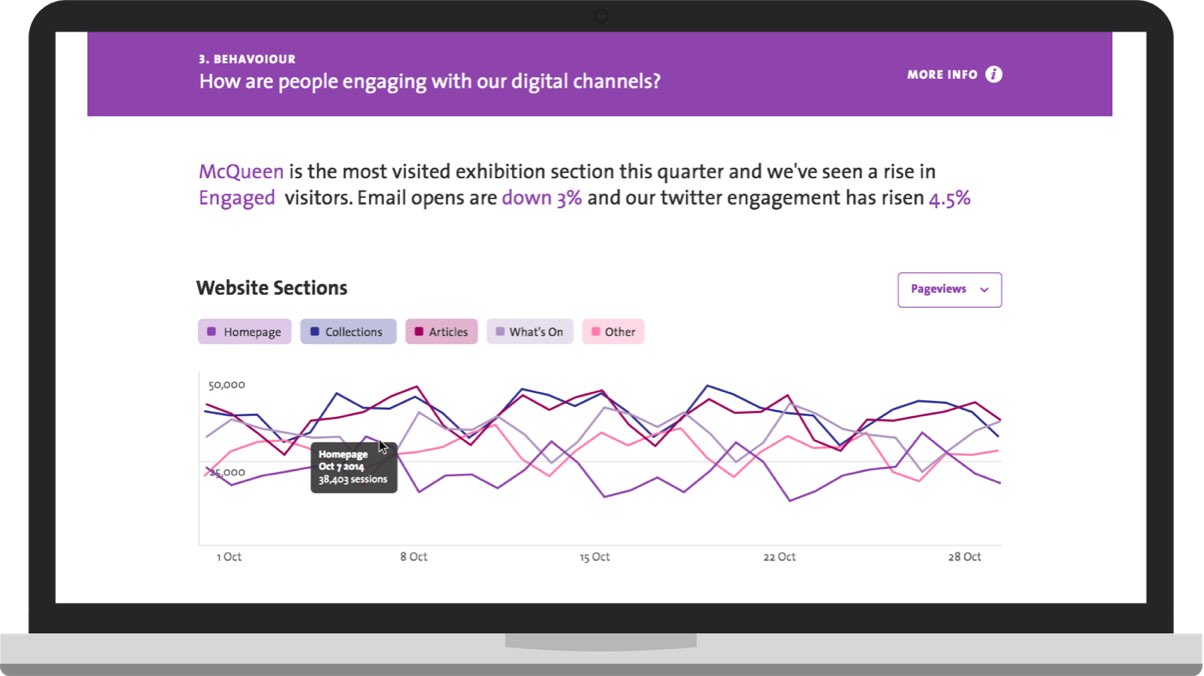
I was first brought in a couple of years ago to help develop a bespoke dashboard for the V&A’s board members. Since then, I’ve been involved with each piece of the V&A website as it’s been relaunched. I’ve created reports and dashboards for various teams, carried out research to inform future developments, and given training for various members of the digital team.

What do you find most challenging about the projects and why?
The V&A has a huge range of online activities. You can use the site to browse the online collection, read articles and research, plan a visit, buy tickets and products, become a member, licence an image, and plenty more besides. Each activity adds to the complexity of the analytics setup, so that’s one challenge.
A more significant challenge is that some of the intended outcomes of those activities lend themselves to being tracked more than others. If you’re not careful you might focus on things that are simple to measure, rather than things that matter.
Also, the scale of the V&A’s activities and profile means that we’re pushing the limits of some of the analytics tools that we use. We just don’t have the budget for premium tools.
How do you go about solving those challenges?
Part of it is about being flexible and pragmatic – there’s usually more than one approach to a problem and sometimes it’s about picking the right tool or technique for the job. I’m also fortunate enough to have worked with lots of cultural organisations that are dealing with slightly different versions of the same challenges.
It’s a massive help that the V&A’s digital team take analytics seriously. Measurement is planned into every project from the very start and they accommodate my requests as much as possible.
I also think it’s significant that delivering an outstanding digital experience is one of the V&A’s five strategic objectives. This sort of thing matters to people here.
How do you work with the digital team when they’re building new products?
We’ve settled into quite a nice working pattern. I’ll usually get a look at early designs or prototypes. From that I can see the types of functionality involved and will make requests for anything I need that will make the new product more easily trackable. That usually comes down to things like:
- well-structured URLs
- data attributes on any elements (like buttons) that we want to track
- the right types of data being added to the data layer
The developers at the V&A are used to the sort of thing I ask for by now. I’ll usually only write up a full spec for the more complicated projects, or where we’re working with external developers.
Then during the QA process I’ll set up the necessary tracking tags and ask for any tweaks to the code that I might need. I’ll often set up a dedicated report at this point to make it easier for people (including myself) to access the relevant data.
What do you mean by data attributes, and what’s the data layer?
This is a bit of a technical one…
If you’re trying to track how many people click on a particular button (for example) on a website then you need to be able to identify that precise button in the code. You can often do that by telling Google Tag Manager to look out for a button with a certain HTML ID, or CSS class, but if someone were to change either of those (which could easily happen) then it’d break any tracking.
Data attributes can be used to fix this problem. They’re little identifiers that can be added to code to help people like me pick out specific elements on the page.
The data layer is different. You can think of it as a little store of data containing extra information about a web page (amongst other things). This is useful because, by default, Google Analytics only collects the page title and URL for each page a person visits.
By putting extra information about the page in the data layer – for example, who the author was, whether it relates to a particular exhibition, and when it was published – we can send that to Google Analytics too. This massively improves the types of reports that we can create.
Have you got an example?
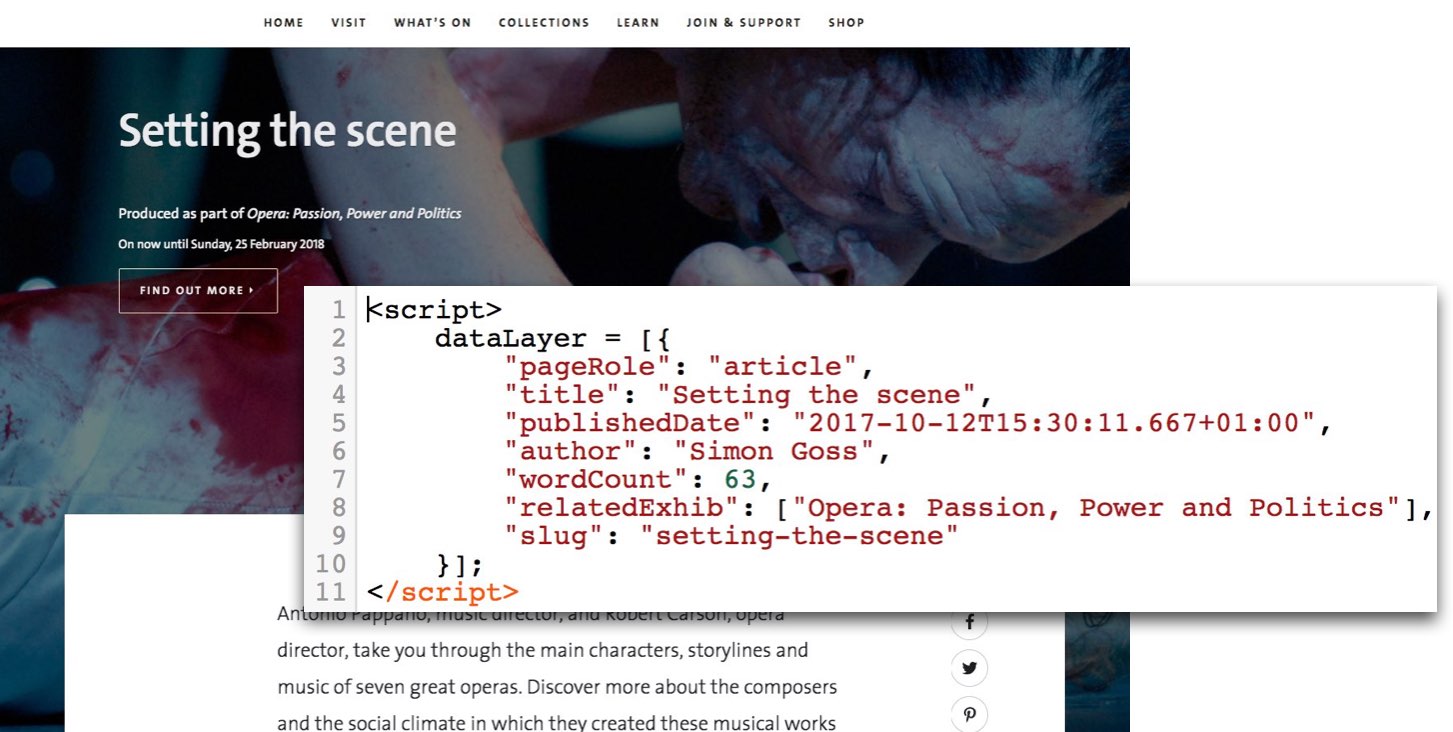
Here’s what it looks like on a recent article. If you view the page source you’ll see the data layer object shown in the screenshot.

In that little block of code you can see that the author is Simon Goss, it’s an article, and it relates to the ‘Opera: Passion, Power and Politics’ exhibition.
By bringing this sort of information into Google Analytics we can easily create reports showing stats for:
- all articles
- all articles written by Simon
- all articles published in October 2017
- all pages (not just articles) that relate to the Opera exhibition
Anybody who’s had to pull together reports like that manually will understand what a game changer this is! Sadly, very few people customise their analytics in this way so they struggle.
Any tips for teams or product managers getting started with Google Tag Manager and Google Analytics?
I recommend people work their way through Google’s Analytics Academy first and then get the Google Analytics Individual Qualification. That’ll give you a foundation to work from.
Like the museum sector, digital analytics is an area where people share their knowledge generously. So follow people like Simo Ahava, Krista Seiden, and Avinash Kaushik, read all their stuff, listen to podcasts, and attend any meetups you can.
Beyond that, the best way to learn is by doing. Put together a simple website, add Google Tag Manager, and start following some online tutorials. I’m sure you’ll have the basics down in no time.


How you ca Calculate this Digital Analysis Phonemantra Blog
See https://www.growcode.com/blog/challenges-ecommerce-directors-face-everyday how important it is to analyze the market. Now, many tools are used to facilitate the work in the e-commerce industry. I recommend.
nice post Spotify features
I would suggest you to embed live chat on your website and have 24/7 live chat agents to monitor digital analytics it does really help
Thanks for the feedback!