Conservation Journal
Spring 2001 Issue 37
Colour Changes for the V&A Facade
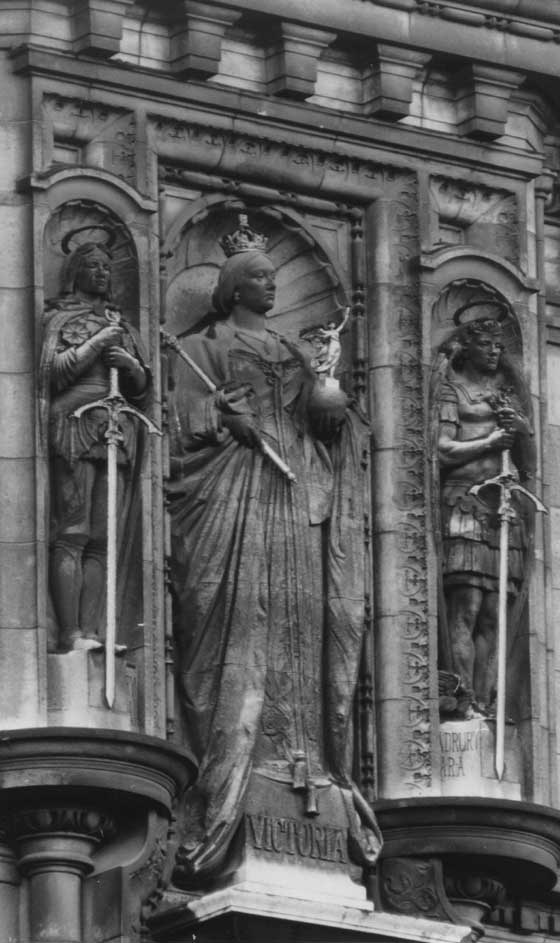
Figure 1. Photograph of the statue above the museum's main entrance, showing the dark soiling obscuring detail. Photography by V&A Photo Studio (click image for larger version)
The foundation stone of the V&A's main building was laid by Queen Victoria in 1899 and the building completed in 1906. The facade, made from principally from red brick and Portland stone, includes some intricate carving and statues that had become totally obscured by thick black surface accretions and soiling from air born pollutants in the eighty years ensuing its completion (figure 1).
In the mid 1980's the V&A started investigating how industrial cleaning processes might be adapted safely to clean the facade. Traditional techniques were considered too damaging for the facade, having been developed chiefly to accommodate speed of operation.
Both dry sand blasting and wet grit blasting techniques can cause considerable erosion even at low pressure. Wet techniques can also force water to penetrate the stone. On the other hand, air abrasive techniques using very fine aluminium oxide powder, low pressures and very fine nozzles, as used by conservators, although very effective, were considered too resource intensive for a project of this scale.
In the end, in consultation with the contractors who were to carry out the work, two techniques were employed as a compromise between cost and potential damage to the facade. A damp system, using minimal amounts of water sufficient only to reduce air borne dust (at a pressure of 1.54 kg/cm²), was used for the general areas of stone work and a dry blasting technique, using fine aluminium oxide powder (and a 3 mm pencil nozzle at 1.4 kg/cm²) for the carved areas.
Cleaning of the facade along Cromwell Road started in late 1989, taking over a year to complete and costing £1.5 million (with about as much again for structural repairs and repointing, carried out on the facade in coordination with the cleaning). As expected, the initial results of the cleaning were dramatic (Figure 2).
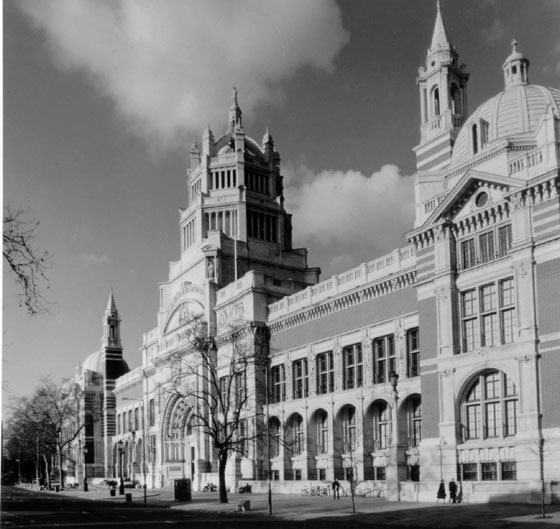
Figure 2. The main facade approximately two years after completion of the cleaning, showing its dramatic effect. (click image for larger version)
To assess the success of this major cleaning project and determine the rate of subsequent discolouration, six vertical areas at various heights and locations on the facade were chosen on completion of the cleaning for extended colour monitoring over eight years.
In consultation with Richard Cook (former head of Sculpture Conservation at the V&A), three areas were chosen at roof level (two on part of a balustrade, facing north and relatively secluded, one on the face of the dome, facing south and relatively exposed) and three at ground level (one on the main facade, facing south and relatively exposed, and two on the first column in Exhibition Road, one facing west and one south, both fully exposed).
For relocation, the areas were marked with a small notch and outlined using a wax pencil. The measurement locations were also recorded photographically at several stages during the project.
Experimental considerations
Colour measurements were taken with a Minolta CR200 Chroma Meter. This measures tristimulus colour values of areas of approximately 8 mm diameter, employing a d/0 spinc geometry.
Several drawbacks of the Chroma Meter were considered before embarking on the project. Firstly, the meter has limited precision for measuring absolute colour but, given the size of the colour changes expected, the precision of measurements separated by long periods of time was considered acceptable. A further consideration was the small size of the measurement area. However, considerable care was taken in the judicious choice of tested areas and the measurements were extended to include the lightest and darkest region of each of the stones containing a sampling area.
Experimental procedure
The contrast was taken as the colour difference between the average of 15 colour readings in the lightest and 15 in the darkest area of a stone. These measurements give useful additional information to the colour monitoring.
Readings on the principal tested areas were taken as ten separate measurements, using the average and standard deviation of the tristimulus values to represent the best estimate of the true value and the uncertainty associated with the measurement. Data were converted to the CIELAB 1 colour space to analyse the visual significance of changes. Total colour changes were determined using the simple CIELAB colour difference formula (∆E*ab=√ [(∆L*)2+(∆a*)2+(∆a*)2]) as well as the more sophisticated CMC adapted colour difference equation. In addition to examining changes in the native variables (L*, a*, and b*), changes in the visual correlates of colour (hue and chroma, in addition to lightness) were investigated.
Results and discussion
There was considerable variation in the colour changes occurring at the different measurement sites. As expected, the largest and most regular changes occurred in the most secluded areas. The deposition material on the surface of the stone is complicated by wind and water erosion of the surface in exposed areas. Water will also preferentially remove calcium sulphate and calcium nitrate, formed by the reaction of the calcium carbonate stone with corrosive gaseous pollutants in the atmosphere, from the surface. Indeed, even very soiled limestone buildings have areas were the stone appears pristine due to continued erosion and leaching.
Substantially the largest contribution to the overall colour change was due to changes in lightness (see Figure 2). This is in agreement with previous studies - most experiments on soiling of buildings use simple reflectance measurements which correlate well with lightness. If the contribution of hue and chroma changes to the soiling were significant, the use of reflectance as a significant variable would need to be reconsidered. Further, for all areas, there was little difference between changes expressed using the simple ∆E*ab formula or the more complicated CMC formula.
Most areas of the building are getting darker with time. The most exposed areas form an exception. Although the overall changes remain small, these show both positive and negative lightness changes between readings, with one of the areas remaining lighter than the initial value throughout the nearly eight year monitoring period. Substantial local staining was observed in one of the stones in the most exposed area. These stains appeared over the first two years of monitoring, showing continual but slower changes thereafter. They are significantly different from the soiling occurring in other areas and are probably due to the migration of iron from a contamination source in contact with the stone.
Reasonably exposed areas on the main facade (regardless of height) showed changes intermediate in behaviour to the very exposed and secluded areas. The areas darkened evenly with only small accompanying changes in contrast of the stones. Changes were similarly rapid to those for secluded areas for the first two years of monitoring but then showed smaller increases over the next year and only gradual, irregular, changes thereafter. The darkening is accompanied by a small but noticeable yellowing of the stone. These areas are the most representative of the changes in appearance of the facade.
Secluded areas showed continuous decreases in lightness and increases in colour difference with time. The changes for these areas were the largest observed. The stones in these areas also showed greater increases in contrast with time than did those in other areas and developed localised dark and light areas. This indicates that the soiling mechanism is sensitive to small local changes in position, probably due to a combination of the effects of localised wind vortices and preferential tracks for water running down the building in heavy rain. The reflectance in these areas dropped by 30% within 3 - 6 years.
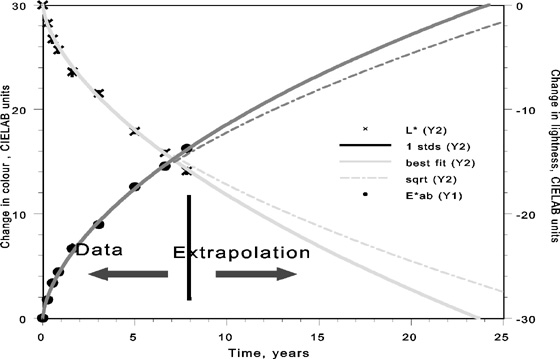
Figure 3. Graph of the colour and lightness changes of the most secluded monitored area (click image for larger version)
Figure 3 summarizes the changes with time for the most secluded measurement area. The graph shows changes in CIELAB colour difference, ∆E*ab, and lightness, ∆L*. The curves show a very good correlation to the square root model predicted empirically. The correlation to an exponential fit predicted by theory is less convincing - especially for this particular spot - but still quite reasonable for the sheltered areas. Given the crude assumption implicit in trying to fit this data that the suspended pollutant levels in the vicinity of the faced remain approximately constant, the lack of fit is easily accounted for.
The weighted linear regression of the relative change in reflectance (Y/Y initial) as a function of the square root of the exposure time gives a very good fit (R2= 0.999). The rate of change of reflectance is significantly greater than that observed by Beloin and Haynie and would match their predictions only if average levels of suspended particulates were as high as 2000 µg/m3! More reasonable estimates of average levels of suspended particulate of about 110 µg/m3 are obtained using the square root regression relationships recently published by Pio et al.
The square root extrapolation predicts that the most sheltered areas will have changed colour by 25 CIELAB units in 20 years and a further 10 units in the ensuing 20 years (the best fit curve predicts slightly larger changes than the fit to the square root of time). The effects of the cleaning for these sheltered areas will therefore barely be visible after 25 years. However, it is the slower and less predictable changes in the partially exposed facade which will determine the appearance of the building and the data for these fluctuates too greatly to be confident in any extrapolation.
Summary
The study has reaffirmed the following observations, based on work over smaller timescales and limited to reflectance data only:
-
there is considerable variation in response between sites
-
changes in the most secluded areas are the most predictable (and the largest)
-
the largest single contribution to the colour changes are changes in lightness
-
the building is generally getting darker (and slightly yellower) weathered areas show smallest changes.
In addition, the following new conclusions can be drawn:
-
extending the monitoring duration to greater than 18 month (the longest previously published study) has shown differences in the behaviour of exposed areas not subject to substantial weathering (the bulk of the facade) and secluded areas
-
the empirical relationship to the square root of the exposure, found for short studies, holds for data from secluded areas over the eight year monitoring period.
Acknowledgements
Given the extended duration of the monitoring for this project, many people have been involved in collecting the data. I would like to acknowledge in particular the help of Richard Cook in setting up the project and David Ford for assistance in taking the measurements.
Bibliography
Beloin, N.J. and Haynie, F.H. Soiling of building surfaces, Journal of Air Pollution Control Association 25(4), 1975, pp 39 - 403
Haynie, F.H. Theoretical model for the soiling of surfaces in: Aerosols, ed S.D. Lee, T. Schneider, L.D. Grant and P.J Verkerk, Lewis Pub., Michigan, 1986, pp 951 - 959
Lanting, R.W. Black smoke and soiling in: Aerosols, ed S.D. Lee, T. Schneider, L.D. Grant and P.J Verkerk, Lewis Pub., Michigan, 1986, pp 923 - 932
Pio, C.A., Ramos, M.M., and Duarte, A.C., Atmospheric aerosol and soiling of external surfaces in an urban environment, Atmospheric Environment, 36 (11) 1998, 1979 - 1989
References
Spring 2001 Issue 37
- Editorial - Size Matters
- The Treatment of Mail on an Arm Guard from the Armoury of the Shah Shuja: Ethical Repair and in situ Documentation in Miniature
- Management of Large Objects at the Science Museum, Wroughton
- Digital Weightlifing and the Conservation of Large, Heavy Objects
- Four Terabytes and Counting
- Colour Changes for the V&A Facade
- Review of 'Gilding: Approaches to Treatment' UKIC Gilding Section Conference