Conservation Journal
Autumn 2009 Issue 58 special edition
What's the difference? Climate comparisons for the Medieval & Renaissance Galleries
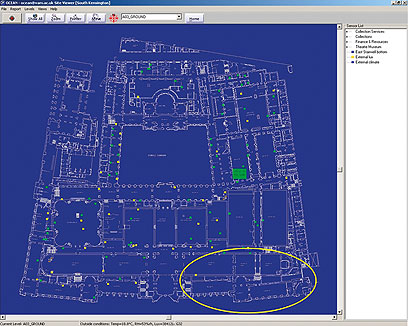
Figure 1. OCEAN: V&A South Kensington ground floor. Sensor positions are indicated by the coloured square icons (the colour representing current climate status). Medieval & Renaissance Galleries lie within the yellow ellipse.
For a prestigious and ambitious development such as the Medieval & Renaissance Galleries, the final appearance of the objects on display is a major driver for the successful delivery of the project. However, the act of displaying artefacts inevitably impacts on their preservation. Understanding the interaction between collections and their environments is an essential element in determining display strategies that adequately balance the needs of current visitors (in terms of the ability to see, enjoy, and understand the exhibits) with long-term preservation issues for the artefacts. This article describes a new analytical approach developed at the V&A to allow gallery climates quantitatively to be assessed in terms of the hazards they pose to artefacts. The approach was developed in response to the changing environmental decisions being made during the M&R project and examples of the analysis on climate predictions for galleries within the scheme are presented here.
In keeping with current trends, one of the intentions for these galleries was to place as much of the collections as possible on open display. A double-height gallery in the centre of the development houses environmentally robust artefacts, compatible with daylight illumination and not requiring undue attention to the climate. More delicate objects, including works on parchment, manuscripts, tapestries, polychromed wood, textiles and carpets, are housed mainly in the surrounding perimeter galleries.
With increasing emphasis being placed on energy efficiency and pressure to reduce overall costs, the initial plan to air-condition the perimeter galleries was rejected and more sustainable approaches for providing suitable climates were sought (the scheme finally chosen is described in a separate article by Bingham and Walker in this journal).
Abandoning reliance on air-conditioning is not of itself a revolutionary concept. The past two decades have seen considerable developments in our understanding of the interactions of museum collections with their climates. Vague suggestions of how objects might be affected have been replaced by sophisticated mechanical models to determine their response. Previous spirals of specifying ever tighter ranges of temperature and humidity 'acceptable' for objects on display, based to large degree on the limits of what might (theoretically) be achieved (with ever more sophisticated and expensive control equipment) coupled with an uncertainty about the long-term effects of all but quite large fluctuations, have been shown to be of limited benefit to the majority of artefacts. The resilience of collections to moderate fluctuations, together with a realisation that very tight performance specifications are very difficult, if not impossible, to achieve,1 has led to more relaxed and realistic specifications being accepted by many institutions. Indeed, the V&A's Environmental Policy, published in 1991, already contained quite pragmatic climate specifications, with relatively broad ranges for temperatures and humidity (18 to 25°C, 40 to 65%RH).
Although the move away from air-conditioning is not out of keeping with other galleries at the V&A, when combined with the emphasis for objects on open display it inevitably influences the climates to which these objects are subjected. This begs the question of how to predict the consequences of these decisions on artefacts, and, more broadly, how to predict the risks to artefacts posed by different climates.
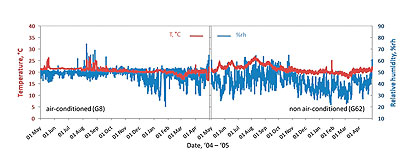
Figure 2. Traditional times series plots for one year for an air-conditioned (left) and a non-air conditioned gallery (right).
In 2003, the Museum embarked on a four year project to develop and deploy an estate-wide climate monitoring system (Object Centred Environmental Analysis Network - OCEAN).2 The system (Figure 1) was first deployed in the south east quadrant of the V&A. By 2006, the time when decisions on the future of the air-conditioning for the Medieval & Renaissance perimeter galleries were being considered, three years of climate data already existed for these spaces. These data formed the starting point for developing a risk-based approach to the analysis of gallery climates in terms of artefact preservation.
Figure 2 shows data for one year in traditional time series plots for two galleries within the Medieval & Renaissance development. One of the galleries (G8) was air-conditioned, whereas the other (G62, one floor above) was not. Such plots allow simple determination of maximum and minimum values of the parameters, and, with practice, even allow estimation of the ranges within which the majority of the data lie. However, they are of little use for determining the relative merits of the climates in the two galleries. (In the figure, temperature is represented by the red line, plotted against the left axis, whilst RH is represented in blue, plotted against the right axis. The range of temperatures in the two galleries is approximately equal, 16 to 26 °C , but the RH spread is slightly larger in the air-conditioned space, 20 to 74%RH versus 21 to 65%RH.)
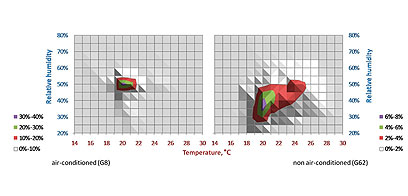
Figure 3. Climate footprint plots showing the same data as Figure 2.
Figure 3 shows the same data, rearranged and plotted in the temperature - relative humidity (RH) plane, with the colours representing the proportion of the data at any given temperature and RH. The air-conditioned and the non air-conditioned spaces are now clearly distinguishable with the air-conditioned gallery climate occupying a significantly smaller area that the unconditioned gallery climate. Such graphs are well suited for representing climate distributions when considering relative thermodynamic permanence. For artefacts entirely insensitive to fluctuations, this determines the merit of different climates.3 However, for most artefacts, the thermodynamic stability (i.e. the rate of deleterious reactions) is of only secondary importance as mechanical damage dominates their climate induced decay.
Stresses are induced in artefacts as a result of their expansion or contraction, relative to some constraint, as they respond to changes in climate. Generally, such dimensional changes will either be small or will be dominated by the response to changes in relative humidity. It is rare for mechanical damage to be due solely to moderate fluctuations in temperature. Therefore only fluctuations in RH need in general to be considered for predicting risk of damage.
It takes time for materials to regain respond when the local RH changes. An increase in RH, for instance, will cause wood to expand but thin layers of material (such as wood inlay or veneer) will equilibrate to the change in a matter perhaps of hours whilst a solid piece of wood might take many days or even weeks to respond fully. The response of artefacts to changes in RH will therefore depend on both the magnitude and the duration of the changes. Even quite large fluctuations in RH will have only minimal impact if they occur over periods too short for a significant response. To take account of the many possible different rates of response, the full analysis considers fluctuation periods ranging from 24 hours to one month.
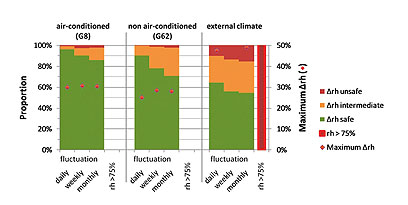
Figure 4. Climate traffic lights for assessing daily, weekly and monthly RH fluctuations for the data as in Figure 2, together with the external climate.
Figure 4 shows the output from this stress field analysis. In this chart, green areas represent the times for which induced stress fluctuations remain moderate and safe (very small risk of damage). Orange regions represent tolerable but not entirely safe stresses (small to moderate risk of damage in time) and red areas represent unsafe induced stresses (high risk of damage). Bars are overlaid with a red lozenge indicating the maximum value of each of the fluctuations (plotted against the secondary y-axis). The fluctuation periods are indicated on the abscissa. The chart also indicates incidences of excessively high RH (>75%, risking of mould and fungal growth). Using this analysis, climates can be distinguished in terms of the risks posed to collections merely by comparing the proportions of unsafe fluctuations. For well-defined collections, this comparison need consider results only for the fluctuation period closest to their response rate. For less well-defined collections or collections with different rates of response, the ratios for each of the fluctuation periods will need to be combined to give a single figure of merit.
As a next step in developing the analysis, extreme value theory approaches have been adapted and applied to fluctuation distributions precisely to quantify probabilities of exceeding critical fluctuation magnitudes. However, the mathematics used in this approach were developed to predict, amongst other things, risks in financial markets; given the recent worldwide economic turmoil, it would perhaps be prudent to verify more fully the appropriateness of this approach before disseminating it further...
References
1. Ashley-Smith, Jonathan, Let's be honest , http://cool-palimpsest.stanford.edu/byauth/ashley-smith/honest.html (last accessed April 2009, originally published in 1994)2. Hancock, Martin, 'The OCEAN project at the V&A', V&A Conservation Journal 46 (Spring 2004)
3. Pretzel, Boris, The RIBA Project: a climate strategy for paper-based archives at the Victoria and Albert Museum in: Preprints, ICOM 14th triennial conference, Vol 1, pp. 681-8, ICOM 2005
Autumn 2009 Issue 58 special edition
- Director's acknowledgement
- Editorial comment - Conservation Journal 58
- Designs on the future: Developing the new Medieval & Renaissance Galleries
- Aspects of the role of Lead Conservator
- Behind the scenes: Conservation and audience engagement
- Medieval & Renaissance Galleries: A passive approach to humidity control
- What's the difference? Climate comparisons for the Medieval & Renaissance Galleries
- A method statement for the Medieval & Renaissance Galleries
- Medieval & Renaissance Galleries conservation progress logs
- New mounts for the headless stone boy and his brother
- Sir Paul Pindar's house on the move again
- Loss compensation at the first floor interior panelling: Sir Paul Pindar's house front
- Training through collaboration - conservation of the Camaldolese Gradual
- A stucco relief by Francesco di Giorgio Martini: Conservation and technical considerations
- The Bourdichon Nativity: A masterpiece of light and colour
- Deteriorated enamelled objects: Past and present treatments
- Stained and painted glass from the Chapel of the Holy Blood, Bruges
- 'This burden of light is the work of virtue': Research on the Gloucester Candlestick
- Digital in-fills for a carpet
- Master Bertram's Apocalypse Triptych: To clean or not to clean
- Professional development in a project culture
- Work in progress: Holbein's drawing processes
- Conservation: Principles, Dilemmas, and Uncomfortable Truths - a summary
- Acknowledgements and Conservation Department staff photograph
- Conservation Department staff chart
- Editorial Board & Disclaimer
- Printer Friendly Version
- Work in progress: the development of the Medieval & Renaissance Galleries