Hello, and a Happy New Year to you! I’m George Oates, director of a small London design firm called Good, Form & Spectacle. As part of our ongoing research practice, we’ve made a new toy to help you explore the wondrous Victoria and Albert Museum’s catalogue, the V&A Spelunker. Thank you very much to Kati and the team for inviting us to write a guest post for you here. Onward!
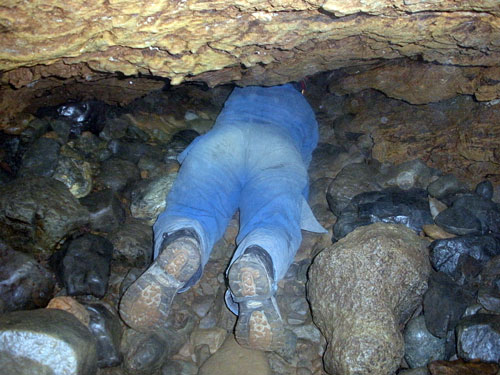
Spelunking is an American word for exploring natural, wild caves. You might also say caving, or potholing here in the UK. I hope using this thing we’ve made feels a bit like exploring a dark cave with a strong torch and proper boots. It’s an interface to let you wander around a big dataset, and it’s designed to show everything all at once, and importantly, to show relationships between things. Your journey is undetermined by design, defined by use.
The Skeleton
In some ways, the spelunker isn’t particularly about the objects in the collection — although they’re lovely and interesting — it now seems much more about the shape of the catalogue itself. You eventually end up looking at individual things, but, the experience is mainly about tumbling across connections and fossicking about in dark corners.
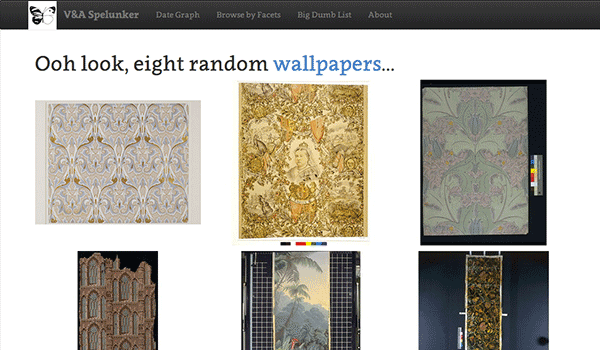
The bones of the the spelunker are pretty straightforward. It’s trying to help you see what’s connected to what, who is connected to where, and what is most connected to where, at a very simple level. You have the home page, which shows you a small random selection of things of the same type, like these wallpapers:
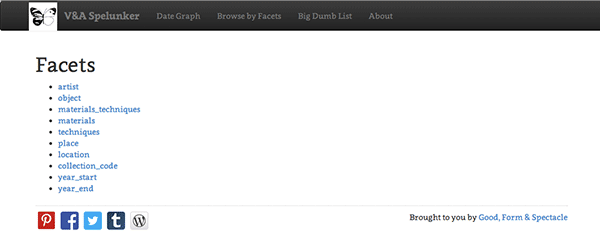
You can also look around a list of a few selected facets:
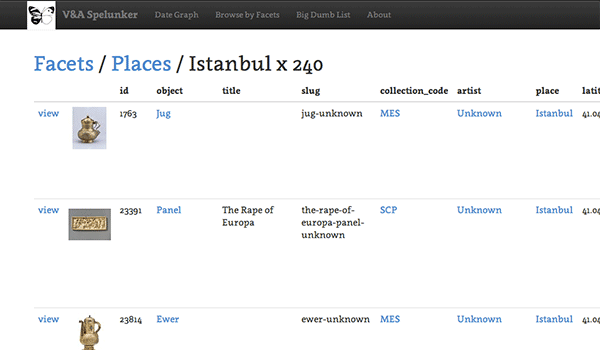
And at some point, you’ll find yourself at a giant list of any objects that match whatever filter you’ve chosen, like hand-sewn things, or all the things from Istanbul:
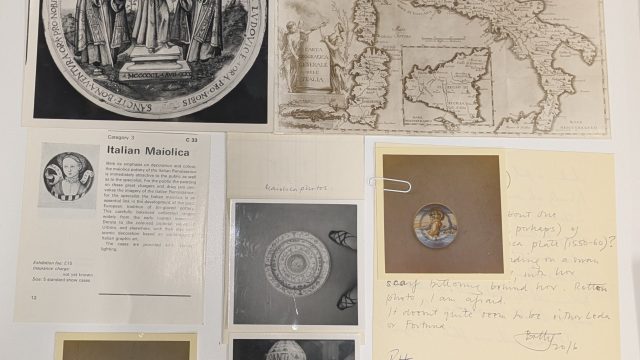
If you see something of interest, you can pull up a dumb-as-a-bag-of-hammers catalogue record view which is just that. Except that it also links through to the V&A API’s .JSON response for that object, which shows you some of the juicy interconnection metadata. Here’s a favourite I stumbled on:
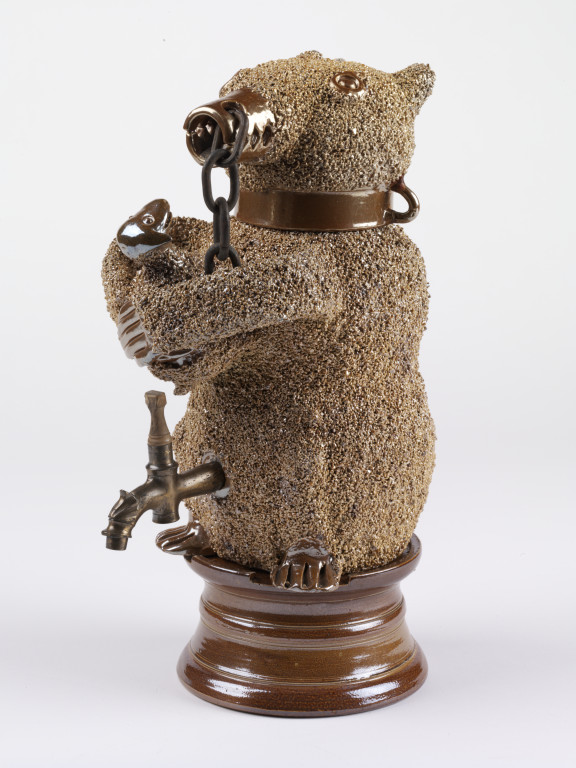
(Incidentally, I was thrilled but slightly frightened to see this “Water cistern with detatchable drinking cup, modelled as a chained bear clasping a cub to its breast” from Nottingham in person in the absolutely stunning ceramics gallery.)
The Beauty of an Ordered List
If you choose one of the main facets like Artist, or Place, you’ll get to a simple ordered list of results for that facet. It’s nice because you can see a lot of information about the catalogue at a glance.
You can see that the top four artists in the catalogue are Unknown (roughly 10%), Worth (as in the House of Worth, famous French couturiers), Hammond, Harry (‘founding father of music photography‘) and the lesser-known unknown. I was curious to learn, at a glance, that most of the collection appears to come from the United Kingdom. (I might be showing my ignorance here, but this was a surprise to me.)
Here are the most common 20 places, with UK in bold:
|
London |
59,661 |
|
England |
42,178 |
|
Paris |
36,890 |
|
Britain |
32,388 |
|
Great Britain |
27,486 |
|
France |
23,540 |
|
Italy |
11,562 |
|
Staffordshire (hello, Wedgwood?) |
11,007 |
|
Germany |
6,666 |
|
China |
5,275 |
|
Europe |
5,260 |
|
Japan |
4,005 |
|
Royal Leamington Spa (3,857 hand-coloured fashion plates, from the ‘Pictorial History of Female Costume from the year 1798 to 1900’) |
3,859 |
|
Iran |
3,411 |
|
India |
3,302 |
|
Jingdezhen (known for porcelain) |
3,261 |
|
United Kingdom |
3,098 |
|
United States |
3,045 |
|
Rome |
2,961 |
|
Netherlands |
2,943 |
Catalogue Topology
Those simple sorts of views and lists start to help you make suppositions about the collection as a whole. Perhaps you can start to poke at the stories hidden in the catalogue about the institution itself. I found myself wanting to try to illustrate some other aspects of the catalogue that just its contents, and that’s when this happened…
The Date Graph
The Date Graph has three simple inputs, all date related. The V&A sets two creation dates for each object: year_start and year_end. Each record also gets a museum_number, which, as in the case of our weird bear, looks like this:
1180-1864
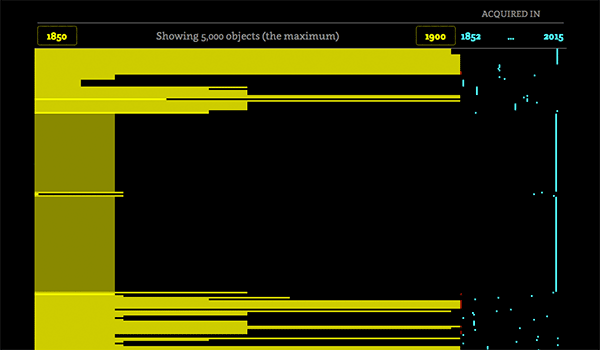
Those last four digits there normally represent the year the object was acquired. So, we snipped out that date and drew all the three dates together in a big graph.
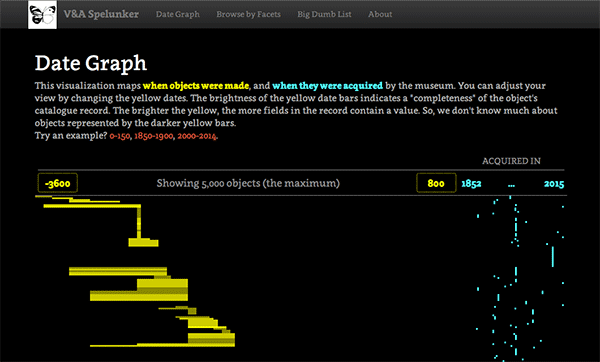
The more you look around the date graph, the more you start to see what might be patterns, like this big set of stuff all collected in the same year. Often these blocks of objects are related, like prints by the same artist, or fragments of the same sculptural feature:
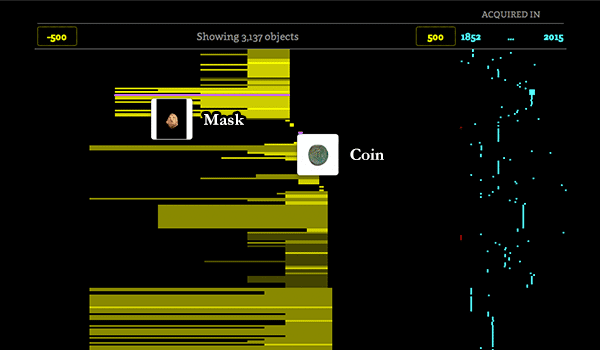
Some objects in the collection have very accurate creation date ranges, while some are very broad, even hundreds of years wide. The very accurate ones are often objects that have a date on it, like coins:
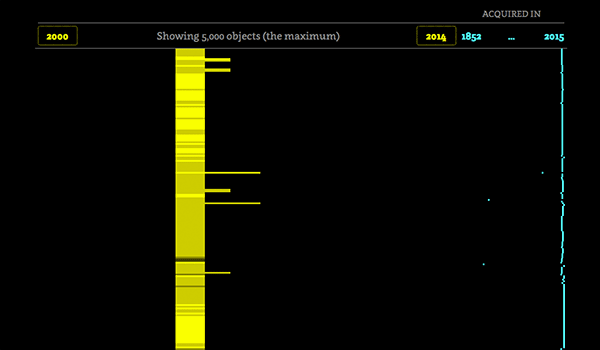
It’s also interesting to see how drawing a picture like this date graph can show you small glitches in the catalogue metadata itself. Now, I don’t know enough about the collections, but perhaps this sort of tool could help staff find small errors to be corrected, errors that are practically impossible to spot when you’re looking at big spreadsheets, or records represented in text. Here’s an example, from the graph that shows objects in the 2000-2014 range… see those outliers that look as if they were acquired before they were created?
Asking Different Questions
I kept finding myself wondering if the Date Graph style of view could show us answers to some questions that are specific to the internal workings of the V&A. Could we answer different sorts of questions about the institution itself?
- When do cataloguers come and go as staff? Do they have individual styles?
- Can we see the collecting habits of individual curators?
- Does this idea of “completeness” of records reveal how software could change the data entry habits used to make the catalogue?
- Do required fields in a software application affect the accuracy of “tombstone” records?
A new feature I’d like to build would be a way to add extra filters on the date graph, like show me all the Jumpers acquired by the museum that were made between 1900-1980.
It’s a Trap Toy
Even though we put in a good effort to make this, it’s still a rough sketch. Now that it’s built and hanging together there are all sorts of things we’d like to do to improve it. If anything, it’s teased out more questions than answers for us, and that’s exactly what this sort of thing should do. My collaborator, Tom Armitage, is also going to write a post over on the Good, Form & Spectacle Work Diary about “Sketching and Engineering” in a little while too, so stay tuned for that.
We hope you enjoy poking around, and we’d love to hear of any interesting discoveries you make. Please tweet your finds to us @goodformand.
Go spelunking!