’The Movers and Shakers of the Royal Albert Hall’ is how the project of visualising the networks involved in the construction of the Royal Albert Hall was first described to me, and who could resist an introduction like that? As a student on the V&A/RCA History of Design MA, and an art installation/fabrication technician, I have always been aware of – and researched – the wider networks involved in making sculptural artworks. This project gave me an opportunity to explore similar makers networks. This time, however, on an architectural scale and using innovative techniques.
The ‘Movers and Shakers’ network
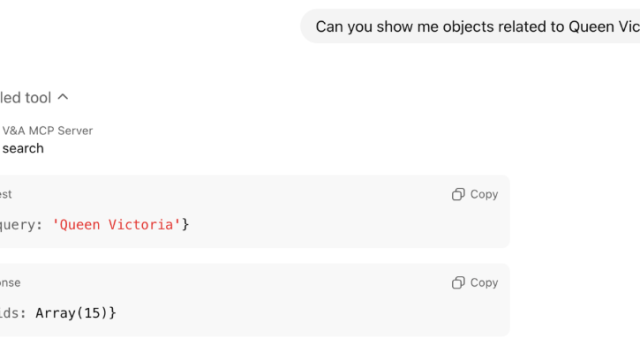
The ‘Movers and Shakers’ network is part of a larger Leverhulme Trust/V&A research project, ‘Designing The Future: Innovation and the Construction of the Royal Albert Hall’ carried out by Dr Simona Valeriani. ‘Designing the Future’ examines how the design and construction of the Royal Albert Hall evolved. It also uncovers the role new technologies and innovative techniques played in producing the iconic building we see today. As you can imagine, keeping track of all the individual players and groups, and of who was involved with what, quickly became a minefield of memory games. So, the idea of using a visualisation tool to map the network came about. This allowed us to see trends in the network and identify key players.
Digital tools
The project involved using the online visual networking tool Onodo, developed in 2015. Onodo is a side project of Fundación Ciudadana Civio and Eurecat, and is a powerful networking tool that allows you to place nodes (people, things, places) and link them. The links and nodes can be labelled to enhance clarity and provide context. They can be static or float around influencing each other’s movements based on the ‘strength’ of the connections. Another characteristic of Onodo is that you can expand the node labels to include images, links and other information about a particular actor within the network. As a result, you can click on an individual node and open a window, where you can find detailed information and a narrative.
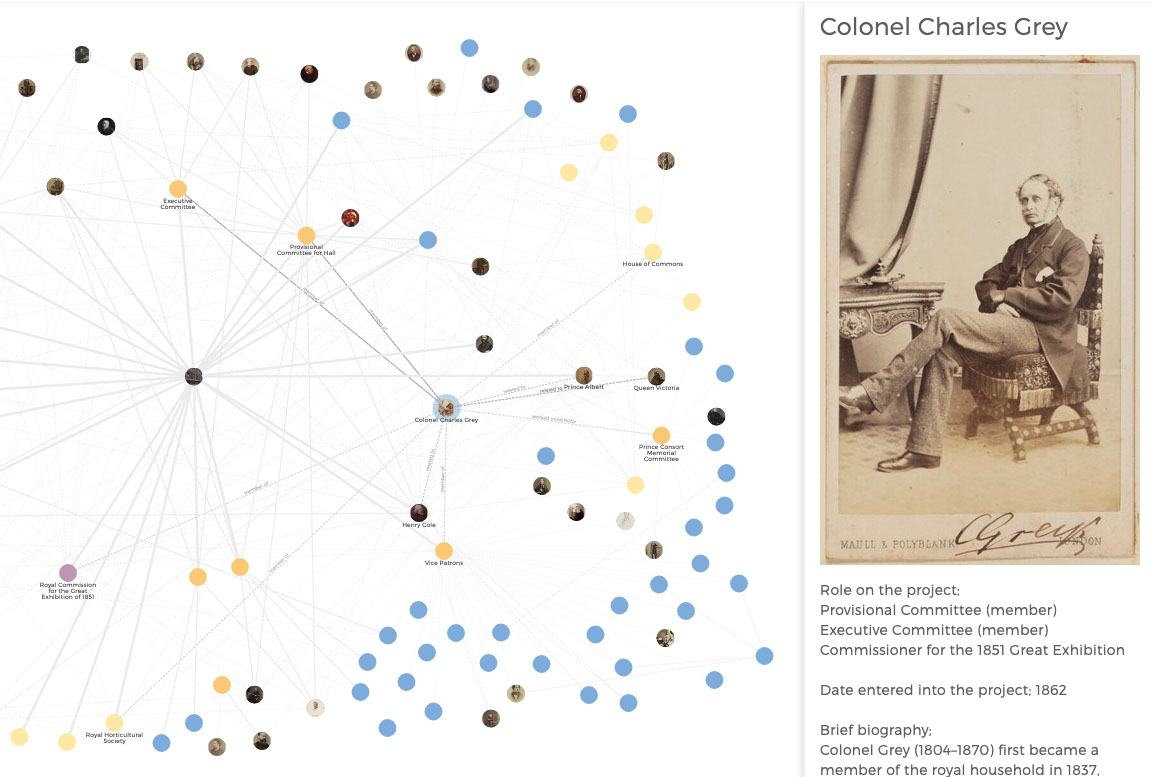
It is very easy to dump in all the material you have related to the network without any organisation. At first this is exactly what happened. However, we soon learnt the error of our ways, and realised more organisation would be needed as the network continued to grow. So how do you organise all of these things? We decided on a basic categorising system: institutions, committees, individuals and firms. As trends started to appear, they became apparent in the network visualisation thanks to colour-coding. Visually this immediately made clear that the number of people and complexity of connections was greater than I had realised.
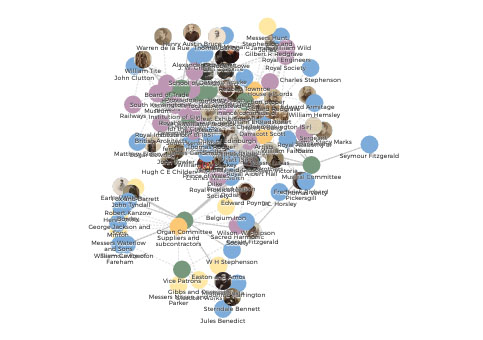
Building and re-building spiderwebs
As the network grew, we were faced with another issue. The complexity of the network was much like an old spider web that had been built upon over and over. You could no longer trace a link because the nodes got in the way. So, I went about reorganising the network, dragging nodes into place. Quite by accident I pressed the pin symbol and the network collapsed in on itself – I sat there in shock. What had I done?!?! Thankfully I was working on a duplicate.
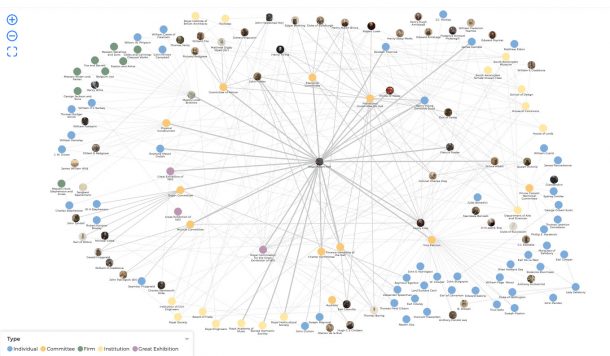
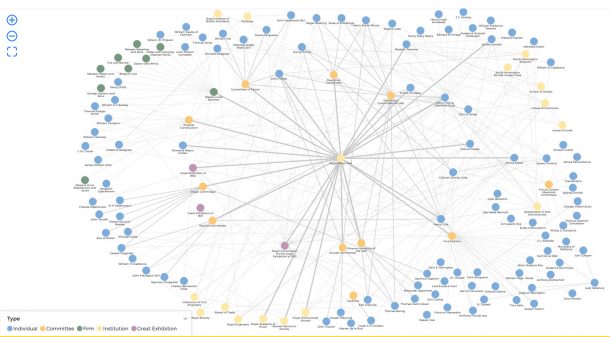
After a deep calming breath (and a good few moments of panic) I realised this was a good thing. I was no longer working to fit the nodes into an old organisation but could start from scratch. A new order emerged: the Royal Albert Hall in the centre, the committees in a circle around this and the individual, firms and companies in a larger oval shape around the outside. The nodes are placed so each link between individual-committee-firm can be seen without interruption, or running through another node that it isn’t attached to.
But why bother? When inputting the information and visualising the network in this way, trends and patterns become visible. It was much more difficult to track down information on those who worked on the physical construction of the building than it was on those who initiated and bankrolled it. This gives us insight into the ‘social value’ held by different people during the time and who have been the focus of historical interest since. It is also incredibly obvious just how interconnected people were once you assign physical links to those connections.
Have look for yourself and let us know what you think!
Some words of warning…
The idea of ‘six degrees of separation’ does mean that setting strict boundaries on the network is necessary, or it could well become an endless task.
And beware of the pin button, for once it’s clicked there are no take-backs. However, if you want to be brave, you can duplicate the visualisation before pressing any buttons you are unsure about.