MAP Laboratory, Centre National de la Recherche Scientifique, is a Network Partner in Architectural models in context: creativity, skill and spectacle, an AHRC-funded research network hosted at the V&A.
CNRS-MAP (Models and simulations for architecture and heritage) laboratory is a French research unit (under the authority of the National Centre for Scientific Research and the Ministry for Culture) investigating scientific and technological issues at the intersection of applied informatics, design processes in architecture, and heritage studies. Two of our research projects, URBANIA and Tactichronie (tangible chronology), explore ways in which a bridge between physical and digital models can be created and used to make architectural heritage more accessible. This blog post will present Tactichronie and will be followed by another one in the series presenting URBANIA.
“What can we do with a tangible model that we can’t do with a virtual model?”
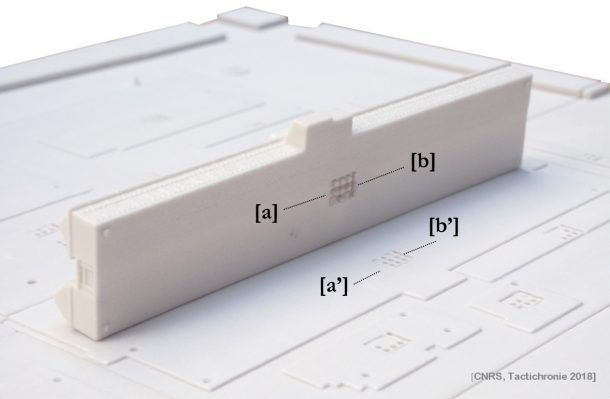
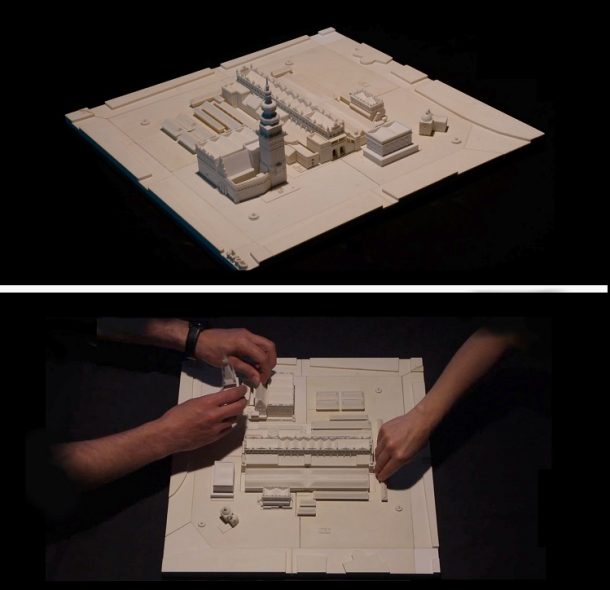
This is the question explored in the Tactichronie project, which involves a physical model produced with a 3D printer (Fig: 1). This proof-of-concept prototype represents transformations that occurred on Krakow’s Market Square (Poland) over a period of 750 years. The prototype combines a master board, 3D physical models of the historical buildings, with a coding of their position on the board and in ordinal time, and a physical timeline for each edifice.
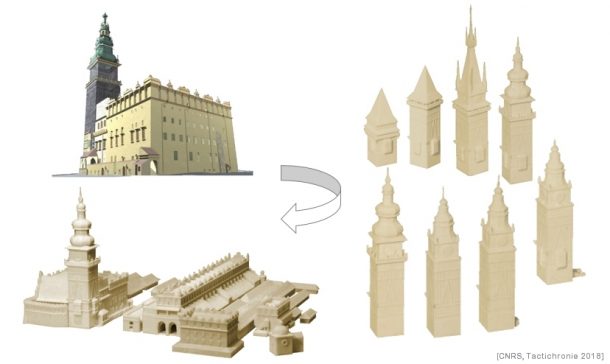
The role of the physical model in this context is to represent and aid understanding of the process of evolution of an urban space, including non-morphological changes, durations and intervals, and uncertainty (a challenging but important element of analytical processes in historical research).
Each historical building is localised in space through a univocal and physical geocode, carved in positive at the bottom of the physical model (Fig: 2). The geocode is a simple 3 X 3 grid composed from flat squares and thick cylinders [a] allowing a clear identification of the edifice (with 512 combinations). In addition to the grid, the geocode includes a small rectangle [b], that acts as a positioning pin and indicates North at assembly time. For each edifice, a corresponding geocode is carved in negative on the masterboard [a’, b’], allowing for an unequivocal and intuitive assembly.
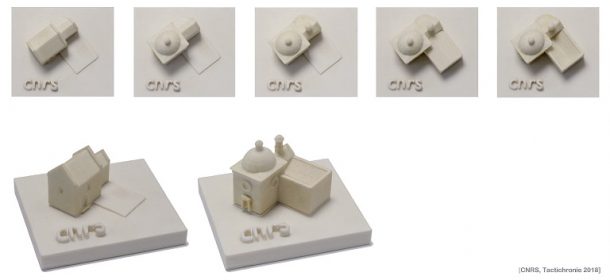
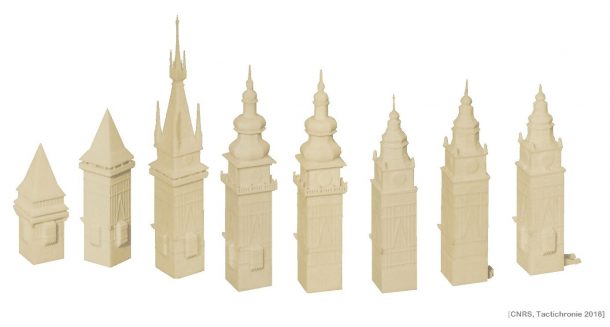
For each building, there are as many 3D physical models as there are successive (and known) morphological evolutions of the edifice (Figs: 3 & 4).
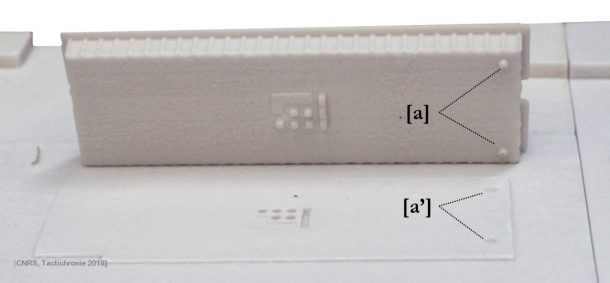
Each group of physical models – representing the evolution of a particular building – can be ordered chronologically thanks to ‘ordonators’ (cylindrical pins), a tangible codification carved in positive beneath the physical model (Fig: 5) [a]. Corresponding slots are carved in negative on the masterboard [a’], allowing users to check at a glance the overall number of known evolutions for each edifice.
A “tangible timeline” called a chronocorde features, for each edifice, physical codifications of dates, durations and uncertainties in dating, and differentiates functional transformations from morphological transformations (Fig: 6). It is composed of small, cylindrical beads representing time units, square elements [a] disposed at each turn of the century and transformation plates. Regular cylinders [b] represent decades. Thicker ones [d] identify the duration of non-morphological transformations (e.g., functional transformation, change of owner). The width of transformation plates [c] represents the duration of the transformation, with an encoding of dates corresponding to the beginning/end of the transformation carved on its vertical borders. Uncertainty of the dating (modelled as levels of a lexical scale that runs from “unsourced, hypothetical” information to “confirmed evidence”) is represented physically by various grooves at the tip of the element, and the position in the order of the artefact’s transformations indexed on the top of the plate.
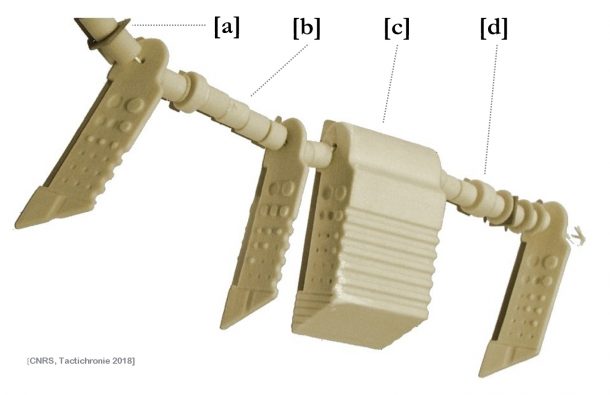
A chronocorde may be used to read the evolution of one specific artefact (Fig: 7) or to match a given evolution of the object with user-chosen selected dates when combining models on the board.

Initially designed for the visually impaired, the prototype was tested with various audiences and subsequently patented and extended to match the requirements of educational tasks (in the context of museums and/or education).
The tangible chronology experiment demonstrates that collation of physical models with the underlying data’s specificity (temporal aspects, uncertainty) does not undermine scientific communication, it helps it.
Iwona Dudek, Jean-Yves Blaise. A Tangible Chronology. Philip Verhagen. 40th annual conference of Computer applications and quantitative methods in archaeology, Mar 2013, Southampton, United Kingdom. Amsterdam university press, Volume II, pp.874-887, 2013, CAA series Computer applications and quantitative methods in archaeology.
To find out more about the network visit our project page.
