I felt something of an imposter speaking at the recent (and nattily titled) Scottish Network on Digital Cultural Resources Evaluation Symposium – #EDCR2016 – which brought together academics and researchers working in the field of cultural and heritage content: I’m not an academic, nor a researcher. Nor Scottish.
But research is part of the daily workings of the V&A’s digital team. So, reflecting on a handful of projects, I explored the different ‘yardsticks’ – the research tools, methods and processes – we’ve used to measure and evaluate our work, at different points within the digital development process. You can find the slide deck on Slideshare.
The three Ws
We find that what research tools you use to measure and evaluate depends on three key things:
- What are you measuring?
- When in the process?
- Why – to what end?
That last one is fundamental. And the answer should not just be ‘because a funder or sponsor needs me to’.
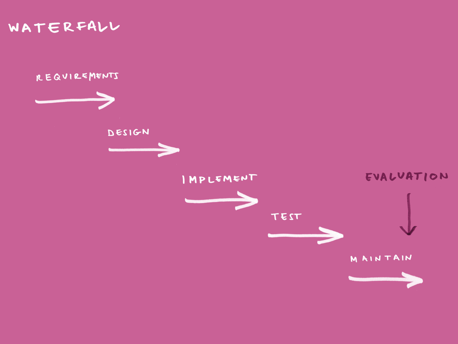
The problem with Waterfall
Within a traditional Waterfall project management approach, evaluation often happens at the end of a process that might well take many months – if not years – to complete. That’s known as summative evaluation. It is valuable, but shouldn’t replace the need for ongoing evaluation and measurement (what’s known as formative evaluation).
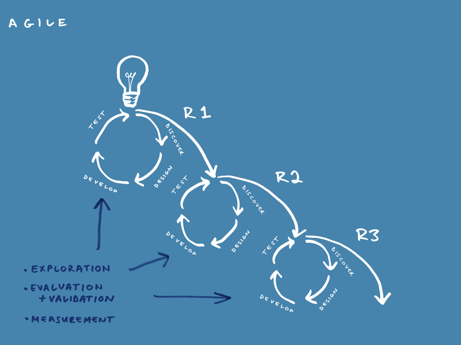
With an Agile approach, measurement and evaluation takes place within each release cycle – and often within each sprint. This has several benefits. It means you get data quickly, and are therefore able to derive insights much earlier in the process. This ongoing, formative evaluation also means you will soon know if your idea is going to fly – with real people, I mean. And if not, you can kill off the idea (or at least take a pause) before it becomes a bloated unnecessary product that doesn’t actually answer people’s needs and wants.
Summative evaluation might still take place several releases down the line, but each one of those releases will be based on deep – and broad – user research and insight. That summative evaluation is therefore more likely to reveal the product is fit for purpose, loved by users and achieving its goals. Which is what a funder wants to hear, right?
The role of the MVP
To get funding and backing for projects, we often need to specify the digital thing we’re going to build, sometimes years ahead of launching it. But how do we know what we’re building before we’ve started the discovery phase of product development?
This is where launching with a minimum viable product (MVP) has a distinct advantage over the grand launch at the end of the Waterfall project. The benefit of launching early with something small – an MVP – is creating something that’s more likely to answer people’s needs, sooner, and in a form that can be iterated and improved. 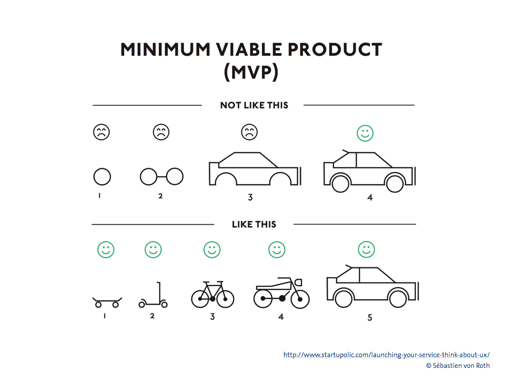
We museum folk need to get out of the habit of specifying big complicated digital things as the end product rather than defining the problem or opportunity to tackle. And we need those who fund and support digital projects to understand that it’s better to specify ‘a vehicle that gets people from A to B’ than a fancy car. Too often we end up promising an over-specced Rolls Royce instead of starting with a simple skateboard.
What people say is different from what they do
We all know this. And we all know that we need to involve people (users) early on in the design and development process. But how do we know if and when to act on what they say?
Christian Rohrer, VP of Design, Research and Enterprise Services at Capital One (part of the Nielsen Norman Group) devised a useful way to understand what tools to use to answer different research questions. The diagram below shows a simple matrix that looks at quantitative vs qualitative data and behavioural vs attitudinal data.
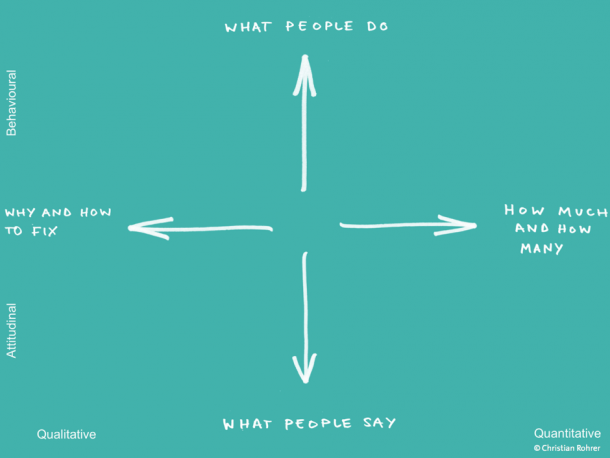
Rohrer’s matrix is a good starting point for working out what questions you want to answer, and therefore what tools can help find those answers. Tools like clickmaps and A/B testing will give you a good insight into behaviour and generate some useful quantitative data. Eye-tracking gives you other behavioural insights but also some qualitative data. Tools like concept and guerrilla testing can help generate more attitudinal, qualitative as well as quantitative data.
Whatever the tool, you’ll want to identify your research goal. Is it exploration (typically during the Discovery phase), evaluation & validation of particular features and their usability (during Design and Development phases), or measurement (during the Test phase)?
So here are some examples of the different types of yardsticks we’ve used at different stages in the product development cycle.
1. Audience analysis: The V&A’s Audience Behaviour Matrix [Discovery phase]
In developing the new V&A website with product innovation consultancy Made by Many, we conducted some analysis of our audience data of online behaviour (primarily from Google Analytics) and from market research with our visitors by Morris Hargreaves McIntyre.
We devised a matrix of audience behaviour that revealed some of the behaviours and motivations of our online visitors. I’ve written about our audience matrix before, so I won’t dwell on the detail here. But this was a useful example of the type of research that takes place in the discovery phase right at the start of digital product development.
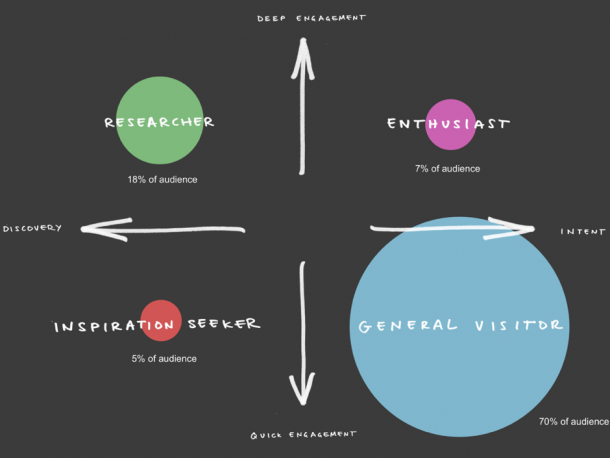
This matrix helped focus on ‘general visitors’ as the key audience behaviour to address in our website rethink and therefore to prioritise features that best serve their needs. Better still, this matrix has become a really useful tool in helping shape and create digital content, giving us a better understanding of what content people might value at different points in their interaction with the V&A online.
2. Remote usability testing: What’s on search [Design phase]
Early next year we’ll be launching our new What’s on, with a much improved user experience, helping our visitors find out about events and buy tickets. Our key goal is to improve discoverability of our events content. We’ve designed a browsing experience that helps visitors find what they’re actively looking for as well as discover events they’re not.
The first iteration of the design focussed purely on discoverability but there was evidence to suggest that search was being used in the existing What’s on. However, it wasn’t immediately clear if this was because of poor user experience (i.e. events just weren’t very discoverable), or whether search would still be a valuable feature in the new design. We were aware of a use case scenario where those who had already heard about an event arrive on the website with the intention of purchasing a ticket, yet aren’t immediately able find it. The design challenge was therefore how we could integrate a search feature into an existing design that had already performed well in user testing we’d previously conducted.
So we developed a clickable prototype with a simple search feature that appeared part way down the page so as not to interrupt the scannability of the landing page. We conducted some scripted user testing with five remote users which simulated a real scenario of having to find an event that wasn’t visible on the What’s on landing page. This test aimed to determine a) if people found the search feature, b) if they did, whether they could use it and c) find the item they were looking for.
Four of the five users found the event by using the search box. While this test involved a small sample and was therefore not conclusive, it did provide some useful insights that confirmed the search box was sufficiently visible yet didn’t interrupt the browsing experience. In fact, five is an optimal number that Nielsen advocate for this type of quick testing when designing new features. It’s an efficient and good value method to verify if a feature is worth bothering with in the first place. Later on, we’ll run more tests at volume.
The feature we’ll launch with is definitely the skateboard of search which will evolve as we glean more data on how it’s used and why.
3. Concept testing and guerrilla testing for the Europe audio guide [development stage]
The evolution of the Europe audio guide deserves a dedicated post, but in the meantime…
Concept testing
We got Frankly, Green and Webb on board for some formative evaluation of the prototype multi-media guide for our new Europe 1600-1815 Galleries that opened at the end of last year. Their research involved concept testing of the guide and revealed that visitors wanted a ‘heads up experience’: they would only get out their mobile phones to discover content they genuinely valued. And that content was audio.
The temptation with this sort of digital product – a mobile in-gallery experience – is to chuck in lots of content that doesn’t fit on the walls. In this case, videos, audio, lots of text, a map… Frankly, Green and Webb’s research reminded us that any mobile product needs to be baked into the broader gallery experience. It needs to be a visible part of the offer, be functional and provide value to the visitor.
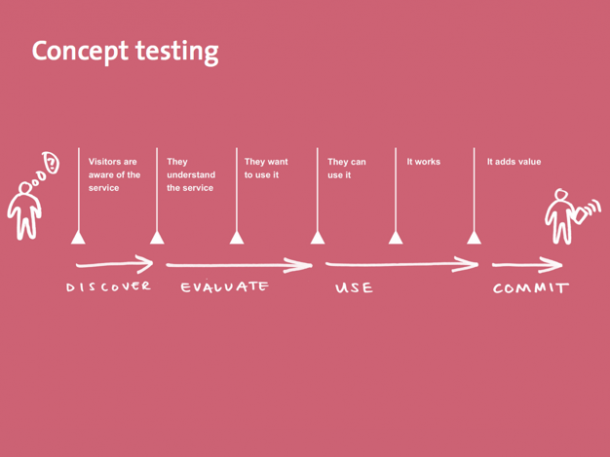
In fact, these factors can be visualised as part of a series of hurdles that need to be overcome before a visitor decides to use that product as part of the visitor experience. Even if it gets past the first five hurdles, unless the product provides value (and, ideally, delight), the visitor won’t bother.
Guerilla testing
The concept testing led us to drastically revise and redevelop the product into a mobile audio guide, which we then tested further. Working in a museum we have the luxury of having thousands of visitors to test with, just outside our office doors. We ran some guerrilla testing – a rapid, low cost method to quickly capture user feedback.
Visitors described the guide as like a treasure hunt, and enjoying the fact that it was like having a tour guide with you, going at your own pace. (This is something Alyson Webb also spoke about at EDCR2016 when recounting her work on the Van Gogh Museum’s multi-media guide which consequently sells itself on helping visitors go at their own pace.) We were surprised by some of the visitor behaviour, observing an older couple using the guide out loud, listening to it together, and not feeling isolated in the way they did with other guides.
We used these visitor insights to improve interactive features like search, and how visitors accessed and played the audio.
Lipstick on a pig
Too often evaluation is an end point, rather than an essential part of the development process. That learning and insight isn’t fed back into ongoing digital development. Waterfall projects have an end date. But Agile never stops. With Agile you’re more likely to feed that research back into ongoing development cycles.
I bet we’ve all been involved in some digital projects that just shouldn’t see the light of day. Some call this putting lipstick on a pig. We need to be braver about killing – or sun-setting – those projects that research reveals are not working or have outlived their purpose. We don’t need to add to all that digital landfill. We need to use research to discover those piglets, not wait until summative evaluation to have our worst suspicions confirmed.
So don’t wait for that moment. Use the right yardsticks and build research into your everyday work.
Thanks to Chris Unitt for helping tease out some of the whys and wherefores that went into writing up these thoughts. And to Chris Pearson for the brilliant visuals, which got a lot of love on Twitter.

Finally a smart blogger…I love how you will be considering and writing!
thankyou for sharing this blog here. this deals with a lot of new tips and information. i really enjoyed by reading this,
I got some new things about the digital development process.Really thank you for sharing these ideas with us.Its really great.Keep posting such type of informative blogs.Thank you. https://www.vouchermedia.com/
Hey,
Thanks so much for this post. The three W’s is a great reminder to help maintain focus during a research project. You defined a lot of interesting points! I will definitely be using some of this information in the future.
Best,
Dennis
Hi,
When is the museum going to reinstate the search function? As a user of the website for the last 9 years I know of lots of useful content that I wish to locate and could do so really quickly if the search function still existed. The website is currently making it really difficult for me to find past content to help with my research and teaching.
Thanks
The three W’s is a great reminder to help maintain focus during a research project.
Nice Post Thanks For Sharing!
http://www.cinphe.com/
I got some new things about the digital development process Thanks For Sharing !
http://www.anpingyadong.com/